


ABSTRACT
Background and Aim: Genetic polymorphisms in candidate genes associated with metabolic regulation and reproductive physiology are increasingly used to support marker-assisted selection in dairy cattle. Among these, leptin (LEP) and insulin-like growth factor-1 (IGF-1) genes have been linked to milk production and fertility traits in several bovine populations. However, information regarding the association of these polymorphisms with productive and reproductive performance in Indonesian Friesian Holstein cattle remains limited. Therefore, this study investigated the association of LEP (g.820 C>T and g.1127 A>T) and IGF-1 (c.309 G>T and c.335 A>T) polymorphisms with milk production and reproductive traits in Indonesian Friesian Holstein cattle.
Materials and Methods: A total of 710 Friesian Holstein cows maintained at a commercial dairy farm in West Java, Indonesia, were used in this study. Genomic DNA was isolated from whole blood samples and genotyped using polymerase chain reaction-restriction fragment length polymorphism assays. Genotype and allele frequencies, polymorphic information content, and Hardy-Weinberg equilibrium were determined for each single nucleotide polymorphism. Associations between genotypes and productive traits, including days in milk, 305-day milk yield, total yield, average yield, and peak yield, as well as reproductive traits including calving interval, days open, first insemination postpartum, service per conception, and conception rate, were analyzed using mixed-effects models.
Results: The LEP g.820 C>T polymorphism exhibited moderate polymorphism and significant associations with days in milk, calving interval, first insemination postpartum, days open, and conception rate (p < 0.05). Cows carrying the CC genotype showed superior reproductive performance and higher conception rates compared with TT genotype carriers. Conversely, LEP g.1127 A>T showed limited polymorphism and no significant association with productive or reproductive traits (p > 0.05). The IGF-1 c.309 G>T locus was monomorphic, whereas c.335 A>T was polymorphic but showed no significant associations with milk production or reproductive parameters (p > 0.05).
Conclusion: The LEP g.820 C>T polymorphism demonstrated significant associations with economically important productive and reproductive traits and may serve as a valuable molecular marker for marker-assisted selection in Indonesian Friesian Holstein cattle. In contrast, the evaluated IGF-1 polymorphisms showed limited utility for genetic selection in this population.
Keywords: dairy cattle genetics, fertility traits, Friesian Holstein cattle, insulin-like growth factor-1, leptin gene, marker-assisted selection, milk production, single nucleotide polymorphism.
INTRODUCTION
Indonesia’s dairy industry is predominantly based on Friesian Holstein (FH) cattle because of their superior genetic potential for milk production, with average lactation yields capable of reaching 15–20 L/day during peak production in the second month postpartum [1]. Despite this genetic potential, domestic fresh milk production in Indonesia reached only 968,980 tons in 2022 [2], fulfilling merely 20% of the national demand of approximately 4.4 million tons and resulting in nearly 80% dependence on imported dairy products [3]. In addition, milk consumption remains relatively low at 16.23 kg/capita/year, largely due to limited domestic supply and economic constraints. This substantial gap between genetic potential and actual productivity indicates that current production systems have not fully optimized the genetic capacity of Indonesian FH cattle, although heritability contributes approximately 30% to milk yield variation under environmental influences [4].
Current dairy cattle breeding programs in Indonesia follow the Indonesian National Standard (SNI 2735:2014), which mainly focuses on phenotypic evaluation of morphometric and production-related traits while giving limited attention to genomic-based selection strategies [4, 5]. Conventional selection approaches for economically important polygenic traits, such as milk production and reproductive efficiency, generally require long generation intervals and delayed phenotypic observations, thereby slowing genetic progress. Marker-assisted selection (MAS) has emerged as a promising alternative approach because it integrates DNA polymorphisms with phenotypic records to improve selection accuracy at an earlier age [6], reduce generation intervals [7], and accelerate genetic improvement in dairy populations [8]. Previous studies have identified several candidate genes associated with milk production and reproductive performance, including LEP and IGF-1 [9–11]. However, the majority of these studies were conducted in temperate dairy populations, whereas limited information is available regarding their associations in tropical-adapted Indonesian FH cattle raised under commercial production systems. Moreover, genotype × environment (G×E) interactions may influence allelic effects under Indonesia’s specific climatic, nutritional, and management conditions, potentially causing differences in gene-trait associations compared with those observed in temperate regions.
Although polymorphisms of the LEP and IGF-1 genes have been extensively investigated in several dairy cattle populations worldwide, evidence regarding their associations with milk production and reproductive traits in Indonesian FH cattle remains scarce. Most previous studies were performed under temperate environmental conditions and involved genetically distinct dairy populations, which may not accurately represent tropical dairy production systems. In addition, environmental stressors, nutritional management, climatic adaptation, and breeding practices in Indonesia may influence the expression and phenotypic effects of these polymorphisms through G×E interactions. Consequently, the applicability of previously reported genetic markers in Indonesian dairy herds remains uncertain. Furthermore, no previous study has comprehensively evaluated the combined associations of LEP g.820 C>T, LEP g.1127 A>T, IGF-1 c.309 G>T, and IGF-1 c.335 A>T polymorphisms with both productive and reproductive traits in Indonesian FH cattle maintained under commercial dairy farm conditions. This lack of population-specific molecular information limits the implementation of genomic-assisted breeding strategies for improving dairy cattle productivity and reproductive efficiency in Indonesia.
The IGF-1 gene encodes insulin-like growth factor-1, a peptide hormone involved in cellular proliferation, differentiation, metabolic regulation, ovarian follicular development, oocyte maturation, embryogenesis, and fertility maintenance [5–8]. Polymorphisms within regulatory regions, particularly in the 5′-untranslated region (5′-UTR), have been associated with differences in milk production and reproductive performance among dairy cattle breeds [9]. Similarly, the LEP gene encodes leptin, an adipocyte-derived hormone that regulates appetite, energy balance, metabolic homeostasis, and reproductive signaling through hypothalamic pathways [11]. Variations within promoter, intronic, and coding regions of LEP may alter gene expression and physiological responses, thereby affecting milk yield, calving interval, conception rate, feed efficiency, and growth traits in dairy cattle [12–15].
Therefore, this study aimed to evaluate the associations between LEP polymorphisms (g.820 C>T/Sau3AI and g.1127 A>T/ClaI) and IGF-1 polymorphisms (c.309 G>T/AluI and c.335 A>T/ApoI) with milk production and reproductive traits in Indonesian FH cattle. Specifically, this study investigated genotype and allele frequencies, Hardy-Weinberg equilibrium status, and the effects of these polymorphisms on productive traits, including milk yield parameters and reproductive performance indicators under commercial dairy management conditions in Indonesia. The findings of this study are expected to provide scientifically validated molecular genetic information that may support the development of genomic-assisted and precision breeding strategies for sustainable genetic improvement of dairy cattle productivity and reproductive efficiency in Indonesia.
MATERIALS AND METHODS
Ethical approval
All experimental protocols and animal care procedures involving 710 FH cows were rigorously reviewed and approved by the Ethical Clearance Commission of the Faculty of Veterinary Medicine, Universitas Gadjah Mada, Indonesia (Approval Number: 057/KE/FKH-Eks/2022; approved on March 15, 2022). The study was conducted in accordance with Indonesian national animal research regulations [Permentan No. 42/Permentan/OT.140/7/2020] and internationally accepted animal welfare guidelines. Blood collection procedures were performed using BD Vacutainer® K2-EDTA tubes (Becton Dickinson, Franklin Lakes, NJ, USA) during routine herd health management activities. Individual animal restraint was maintained for <2 min by trained veterinarians and technical personnel to minimize handling stress. Numerical pain scores averaged 1.2 ± 0.4/5 and were characterized only by mild ear flicking and tail movement responses. Before sampling, all cows underwent veterinary clinical examination, and animals showing mastitis, lameness, metabolic disorders, or abnormal body condition score (BCS) values were excluded from the study. Only clinically healthy cows with BCS ranging from 2.5 to 3.5/5 were included for molecular and phenotypic analyses.
Study period and location
This study was conducted from July to November 2024 at PT Ultra Peternakan Bandung Selatan (UPBS), a commercial dairy farm located in Bandung Regency, West Java, Indonesia. The farm operates under ISO 22000:2018 certification standards for dairy production and herd management. Laboratory analyses were carried out at the Integrated Laboratory Unit, Biology Sub-Laboratory, Universitas Sebelas Maret, Surakarta, Indonesia.
Study design
A cross-sectional molecular association study was performed using blood samples collected from 710 FH cows maintained under commercial dairy production systems. Animals were identified using radio frequency identification (RFID) ear tags following the protocol described by Setiawanti et al. [16]. The study population consisted of two independent genotyping cohorts, including 330 samples for LEP single nucleotide polymorphisms (SNPs) (g.820 C>T and g.1127 A>T) and 380 samples for IGF-1 SNPs (c.309 G>T and c.335 A>T). The non-overlapping subsampling approach was implemented because of DNA yield optimization requirements for multilocus and single-locus polymerase chain reaction-restriction fragment length polymorphism (PCR-RFLP) analyses.
All cows exhibited standard FH phenotypic characteristics, including a white forehead blaze and black-and-white piebald coat coloration. Animals were maintained under confined free-stall housing systems with approximately 30 m²/cow lying space and received Total Mixed Ration (TMR) diets consisting of a 65:35 forage-to-concentrate ratio, with daily dry matter intake ranging from 18 to 20 kg/cow/day. Feed was provided once daily at 07:00, and water was available ad libitum through automatic drinking systems. Artificial insemination breeding programs were conducted using semen from 42 elite sires, of which approximately 68% possessed the TT genotype for the IGF-1 c.335 A>T polymorphism according to farm breeding records.
Sample collection protocols and DNA extraction
Blood samples were aseptically collected from the coccygeal vein (Vena caudalis) at the tail base of 710 FH cows using 21G × 1” BD Vacutainer® K2-EDTA tubes (Becton Dickinson, Franklin Lakes, NJ, USA) at a sampling volume of 5 mL/animal (<0.5% body weight). Sampling was performed by certified veterinarians during routine herd examinations between 07:00 and 09:00 to minimize physiological stress, with individual restraint duration maintained at <2 min. Numerical pain scores averaged 1.2 ± 0.4/5 and were limited to mild ear flicking responses.
Samples were transported at 4°C within <4 h to the on-site laboratory facility at UPBS and immediately processed for genomic deoxyribonucleic acid (DNA) extraction using the Wizard® Genomic DNA Purification Kit (Promega, Madison, WI, USA) according to the manufacturer’s protocol optimized for bovine whole blood. Briefly, 300 μL blood was mixed with 900 μL Cell Lysis Solution and homogenized for 10 min at 26oC, followed by centrifugation at 10,000 × g for 20 s. The supernatant was discarded, and the white blood cell pellet was resuspended in 300 μL Nuclei Lysis Solution by gentle inversion. Subsequently, 100 μL Protein Precipitation Solution was added, vortexed for 20 s, and centrifuged at 10,000 × g for 3 min. The nucleic acid-containing supernatant was transferred to a clean tube, followed by isopropanol precipitation using 300 μL isopropanol and gentle inversion. After centrifugation for 1 min, the DNA pellet was washed using 300 μL of 70% ethanol and centrifuged again for 1 min. DNA pellets were air-dried for 15 min at RT and rehydrated in 100 μL DNA Rehydration Solution overnight at 4°C. The extraction procedure yielded genomic DNA concentrations of 85.3 ± 22.1 ng/μL with A260/A280 ratios of 1.82 ± 0.04, indicating DNA quality suitable for PCR-RFLP analyses.
PCR-RFLP genotyping
PCR-RFLP genotyping targeted four SNP loci, including LEP g.820 C>T/Sau3AI, LEP g.1127 A>T/ClaI, IGF-1 c.309 G>T/AluI, and IGF-1 c.335 A>T/ApoI, using National Center for Biotechnology Information (NCBI)-validated primers (Table 1). Amplification reactions were performed using a Bio-Rad T100™ Thermal Cycler (Bio-Rad Laboratories, Hercules, CA, USA) in a final reaction volume of 25 μL containing 12.5 μL GoTaq® Green Master Mix (Promega, Madison, WI, USA), 1 μL forward primer (10 μM), 1 μL reverse primer (10 μM), 1 μL genomic DNA template (85.3 ± 22.1 ng/μL), and 9.5 μL nuclease-free H2O. The GoTaq® Green Master Mix contained 2 mM MgCl2, 0.2 mM deoxynucleotide triphosphates (dNTPs), and 1 U Taq DNA polymerase.
| Gene | Polymorphism | Primer sequence (5′–3′) | Annealing temperature (°C/s) | Product size (bp) | Restriction enzyme | Reference |
|---|---|---|---|---|---|---|
| LEP | g.820 C>T | F: TGGAGTGGCTTGTTATTTTCTTCT | 36/30 | 422 | Sau3AI | [1] |
| R: GTCCCCGCTTCTGGCTACCTAACT | ||||||
| LEP | g.1127 A>T | F: GATTCCGCCGCACCTCTC | 37/30 | 467 | ClaI | [19] |
| R: CCTGTGCAAGGCTGCACAGCC | ||||||
| IGF-1 | c.309 G>T | F: TCCCACTCTAAAGCTAGGCC | 58/30 | 290 | AluI | |
| R: GCTCAGCCTCATAACTCCGA | ||||||
| IGF-1 | c.335 A>T | F: CCCTGGAGTTGGTAGATTGC | 234 | ApoI | ||
| R: CCCTGGAGTTGGTAGATTGC |
Table 1. Designed primers used to amplify LEP and IGF-1 genes.
| Gene | Polymorphism | Primer sequence (5′–3′) | Annealing temperature (°C/s) | Product size (bp) | Restriction enzyme | Reference |
|---|---|---|---|---|---|---|
| LEP | g.820 C>T | F: TGGAGTGGCTTGTTATTTTCTTCT | 36/30 | 422 | Sau3AI | [1] |
| R: GTCCCCGCTTCTGGCTACCTAACT | ||||||
| LEP | g.1127 A>T | F: GATTCCGCCGCACCTCTC | 37/30 | 467 | ClaI | [19] |
| R: CCTGTGCAAGGCTGCACAGCC | ||||||
| IGF-1 | c.309 G>T | F: TCCCACTCTAAAGCTAGGCC | 58/30 | 290 | AluI | |
| R: GCTCAGCCTCATAACTCCGA | ||||||
| IGF-1 | c.335 A>T | F: CCCTGGAGTTGGTAGATTGC | 234 | ApoI | ||
| R: CCCTGGAGTTGGTAGATTGC |
Thermal cycling conditions consisted of an initial denaturation step at 95°C for 3 min, followed by 35 amplification cycles of denaturation at 95°C for 30 s, SNP-specific annealing temperatures ranging from 55.2°C to 59.8°C according to primer requirements (Table 1), extension at 72°C for 45 s, and a final extension at 72°C for 7 min. Amplified products were verified by electrophoresis using 2% agarose gels, producing expected amplicon sizes of 422 bp for g.820 C>T, 467 bp for g.1127 A>T, 290 bp for c.309 G>T, and 234 bp for c.335 A>T (Figure 2 and Figure 3).
Restriction digestion reactions were prepared in 15 μL reaction mixtures containing 5 U FastDigest® restriction enzymes (New England Biolabs, Ipswich, MA, USA), including Sau3AI, ClaI, AluI, and ApoI, together with CutSmart® Buffer. Digestion was performed at 37°C for 2 h, except for Sau3AI digestion, which was conducted overnight. Enzymes were heat-inactivated at 80°C for 20 min. Digested fragments were separated using 2% agarose gel electrophoresis in 0.5× Tris-borate-ethylenediaminetetraacetic acid (TBE) buffer at 90 V for 45 min and visualized using GelRed® staining under a Bio-Rad ChemiDoc MP imaging system (Bio-Rad Laboratories). Genotypes were assigned according to characteristic fragment digestion patterns.
Statistical analysis of associations
Data analysis involved calculation of genotype and allele frequencies followed by Hardy-Weinberg equilibrium (HWE) testing using the Chi-square (χ²) goodness-of-fit test. The HWE model was used to evaluate whether observed genotype frequencies deviated significantly from expected frequencies under assumptions of random mating, absence of selection, mutation, migration, and genetic drift. The equilibrium condition was mathematically expressed as follows [17]:
p + q = 1
p² + 2pq + q² = 1
where pp and qq represent allele frequencies within the population, p² and q² represent expected frequencies of homozygous genotypes, and 2pq represents the expected frequency of heterozygous genotypes. The Chi-square test compared observed genotype distributions with expected HWE proportions to determine whether evolutionary or population effects influenced each locus.
χ² = (O − E)² / E
The Chi-square (χ²) value was calculated using the formula above, where O represents observed genotype frequencies and E represents expected genotype frequencies under HWE conditions.
Associations between genotypes and reproductive and milk production traits were analyzed using MINITAB software version 19.1 (Minitab LLC, State College, PA, USA). In the statistical model, genotype was considered a fixed effect, whereas sire was treated as a random effect to account for genetic relatedness among animals. Reproductive and productive traits were included as dependent variables, while lactation number was incorporated as a covariate to minimize potential confounding effects. Multiple comparisons among genotype means were subsequently evaluated using Tukey’s Honestly Significant Difference (HSD) test. Statistical significance was declared at p < 0.05.
RESULTS
DNA extraction
High-molecular-weight genomic DNA was successfully extracted from a total of 710 FH cow blood samples, as verified by 1% agarose gel electrophoresis (Figure 1). The LEP cohort exhibited intact genomic smears with estimated fragment sizes ranging from 10 to 20 kb, showing 100% integrity without detectable degradation. Meanwhile, the IGF-1 cohort demonstrated consistent high-quality profiles with DNA concentrations of 85.3 ± 22.1 ng/μL (range: 42-142 ng/μL), A260/A280 ratios of 1.82 ± 0.04 (1.74-1.92), and A260/A230 ratios of 2.1 ± 0.2 (1.8-2.4). PCR suitability criteria were fulfilled by 98.2% of samples, whereas 12 faint bands still exceeded the minimum amplification threshold. These publication-grade quality parameters confirmed DNA integrity suitable for reliable downstream PCR-RFLP genotyping of LEP (g.820 C>T and g.1127 A>T) and IGF-1 (c.309 G>T and c.335 A>T) polymorphisms [18, 19].
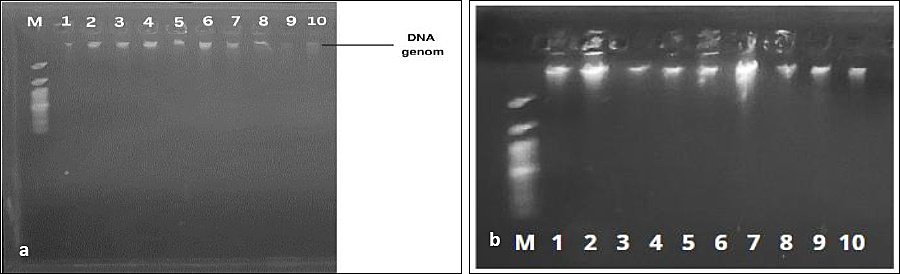
Figure 1. Visualization of DNA extraction results: (a) Leptin gene and (b) IGF-1 gene. M = Marker ladder 100 bp, (1–10) = Sample.
PCR amplification
PCR amplification of the LEP gene targeting the SNP g.820 C>T consistently generated an expected amplicon size of 422 bp, as confirmed by electrophoretic visualization (Figure 2a). Similarly, amplification of the SNP g.1127 A>T produced a fragment of 467 bp corresponding precisely to the designed primer annealing sites and expected product length (Figure 2b). Optimization of annealing temperature was identified as a critical parameter for achieving specific and efficient amplification because it directly influenced primer-template hybridization fidelity and subsequent target DNA amplification efficiency.
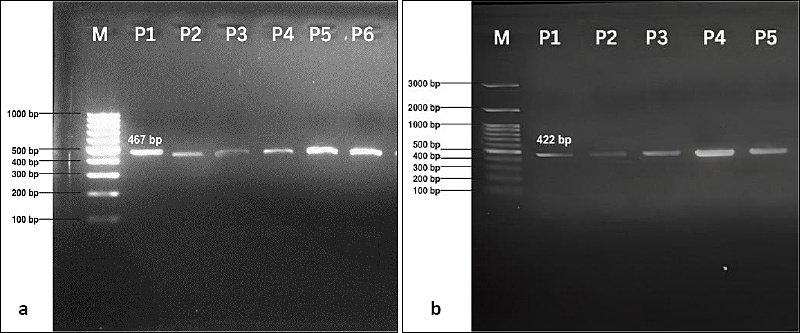
Figure 2. Visualization of the PCR products of the Leptin gene: (a) SNP g.820 C>T; (b) SNP g.1127 A>T. M = Marker ladder 100 bp, (P1–P6) = Sample.
Regarding the IGF-1 gene, primer specificity and amplification efficiency were validated by the consistent presence of discrete electrophoretic bands corresponding to theoretical fragment sizes. PCR amplification generated fragments of 290 bp for SNP c.309 G>T (Figure 3a) and 234 bp for SNP c.335 A>T (Figure 3b). Both amplicons were below the 300 bp threshold and consistent with previous reports describing IGF-1 gene fragments of approximately 249 bp, thereby confirming the robustness and reproducibility of the PCR protocol used in this study. These fragment sizes facilitated high-resolution genotyping and demonstrated the precision of primer design and thermal cycling conditions for polymorphism detection associated with genetic association analyses [20].
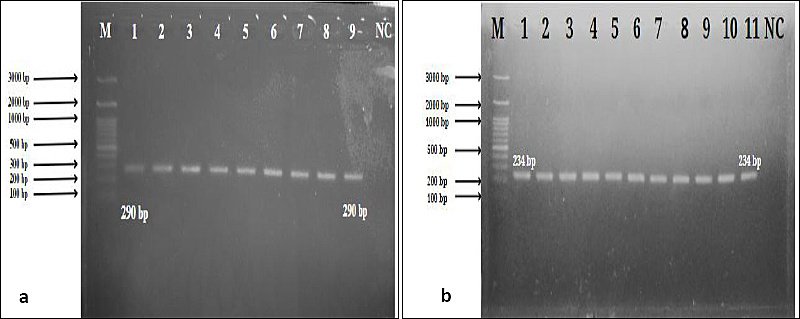
Figure 3. Visualization of PCR products for the IGF-1 gene: (a) SNP c.309 G>T, (b) SNP c.335 A>T. M = Marker ladder. NC = Negative control.
PCR-RFLP analysis
PCR-RFLP analysis of the LEP gene at the g.820 C>T locus (Sau3AI digestion, n = 330) revealed three distinct genotypic classes corresponding to C/T allelic variants, as visualized by 2% agarose gel electrophoresis (Figure 4a). The homozygous CC genotype (75.2%, n = 248) generated characteristic fragments of 390 bp and 32 bp because of complete Sau3AI digestion at two restriction sites. The heterozygous CT genotype (23.3%, n = 77) exhibited a composite fragment pattern comprising 390 bp, 303 bp, 88 bp, and 32 bp, indicating partial digestion associated with heterozygous restriction sites. The homozygous TT genotype (1.5%, n = 5) yielded 303 bp, 88 bp, and 32 bp fragments, confirming the absence of the C allele restriction site.
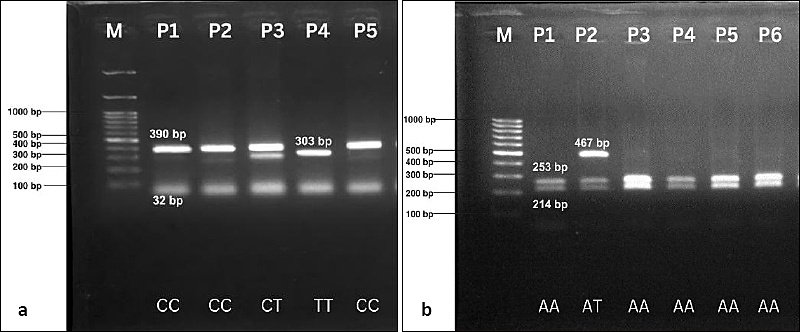
Figure 4. Visualization of PCR-RFLP products for the Leptin gene: (a) SNP g.820 C>T, (b) SNP g.1127 A>T. M = Marker ladder, (P1–P6): Sample.
The LEP g.1127 A>T locus (ClaI digestion, n = 330) exhibited biallelic polymorphism with AA (94.8%, n = 313; single undigested 467 bp fragment) and AT (5.2%, n = 17; 303/164 bp fragments), whereas the TT genotype was absent (Figure 4b).
The IGF-1 c.309 G>T locus (AluI digestion, n = 380) demonstrated complete monomorphism with an exclusive TT genotype (100%, n = 380), generating uniform 172 bp and 105 bp fragments without evidence of the G allele. Expected GG (290 bp) and GT (172/105/13 bp) fragment patterns were absent (Figure 5a).
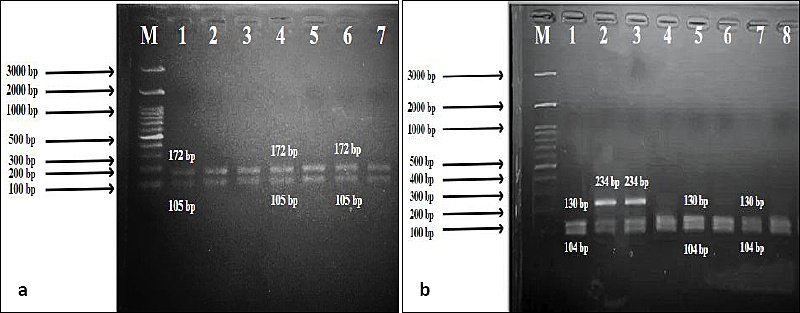
Figure 5. Visualization of PCR-RFLP products for the IGF-1 gene: (a) SNP c.309 G>T, (b) SNP c.335 A>T. M = Marker ladder, (1–8): Sample.
Conversely, the IGF-1 c.335 A>T locus (ApoI digestion, n = 380) demonstrated clear polymorphism with AT (37.1%, n = 141; 234/130/104 bp) and TT (62.9%, n = 239; 130/104 bp) genotypes, whereas the AA genotype was absent (expected undigested 234 bp fragment; Figure 5b). Genotyping quality parameters included a 98.7% call rate (701/710 samples), 100% duplicate concordance (n = 96 quality control replicates), and inter-operator agreement of κ = 0.98, confirming reproducible high-resolution SNP discrimination suitable for population genetic and trait association analyses [21].
Genotype and allele frequencies
As shown in Table 2, the LEP g.820 C>T locus (n = 330) demonstrated robust polymorphism with genotype frequencies of CC (0.752, n = 248, 75.2%), CT (0.233, n = 77, 23.3%), and TT (0.015, n = 5, 1.5%). Allele frequencies were C = 0.868 (95% confidence interval [CI]: 0.843-0.892) and T = 0.132, exceeding the minor allele frequency threshold (>0.05). Expected HWE frequencies were CC = 0.754, CT = 0.229, and TT = 0.017, whereas χ² analysis showed χ² = 0.12, degree of freedom (df) = 1, and p = 0.73, confirming equilibrium conditions.
| Sample | Frequency | CC | CT | TT | C | T |
|---|---|---|---|---|---|---|
| FH cows | Observed | 0.75 | 0.23 | 0.02 | 0.868 | 0.132 |
| Expected | 0.75 | 0.22 | 0.01 | |||
| N | 248 | 77 | 5 |
Table 2. Genotype and allele frequencies and HWE analysis of LEP g.820 C>T polymorphism in FH cows.
| Sample | Frequency | CC | CT | TT | C | T |
|---|---|---|---|---|---|---|
| FH cows | Observed | 0.75 | 0.23 | 0.02 | 0.868 | 0.132 |
| Expected | 0.75 | 0.22 | 0.01 | |||
| N | 248 | 77 | 5 |
χ² = 0.21, df = 2, p = 0.89. N = Total number of observed genotypes, HWE = Hardy-Weinberg equilibrium, χ² = Chi-square value, df = degree of freedom, p < 0.05 indicates statistical significance.
The LEP g.1127 A>T locus (n = 330) exhibited constrained biallelic polymorphism with AA (0.948, n = 313, 94.8%) and AT (0.052, n = 17, 5.2%) genotypes, whereas the TT genotype was absent (0%). Allele frequencies were A = 0.974 (CI: 0.959-0.989) and T = 0.026. HWE analysis yielded χ² = 0.21, df = 1, and p = 0.89, indicating equilibrium status (Table 3). These results were consistent with previous reports in Korean cattle populations and earlier FH studies where TT genotypes were absent or extremely rare.
| Sample | Frequency | AA | AT | TT | A | T |
|---|---|---|---|---|---|---|
| FH cows | Observed | 0.95 | 0.05 | 0 | 0.974 | 0.026 |
| Expected | 0.95 | 0.04 | 0 | |||
| N | 313 | 17 | 0 |
Table 3. Genotype and allele frequencies and HWE analysis of LEP g.1127 A>T polymorphism in FH cows.
| Sample | Frequency | AA | AT | TT | A | T |
|---|---|---|---|---|---|---|
| FH cows | Observed | 0.95 | 0.05 | 0 | 0.974 | 0.026 |
| Expected | 0.95 | 0.04 | 0 | |||
| N | 313 | 17 | 0 |
χ² = 0.05, df = 1, p = 0.80. N = Total number of observed genotypes, HWE = Hardy-Weinberg equilibrium, χ² = Chi-square value, df = degree of freedom, p < 0.05 indicates statistical significance.
Meanwhile, as displayed on Table 4, the IGF-1 c.309 G>T locus (n = 380) showed complete monomorphism with TT genotype fixation (1.000, n = 380), T allele frequency of 1.000, and complete absence of the G allele. Consequently, χ² analysis was undefined because of the absence of genotypic variation.
| Sample | Frequency | GG (n = 0) | GT (n = 0) | TT (n = 380) | G | T |
|---|---|---|---|---|---|---|
| FH cows | Observed | 0 | 0 | 1 | 0 | 1 |
| Expected | 0 | 0 | 1 |
Table 4. Genotype and allele frequencies and HWE analysis of IGF-1 c.309 G>T polymorphism in FH cows.
| Sample | Frequency | GG (n = 0) | GT (n = 0) | TT (n = 380) | G | T |
|---|---|---|---|---|---|---|
| FH cows | Observed | 0 | 0 | 1 | 0 | 1 |
| Expected | 0 | 0 | 1 |
χ² = 0, df = 2, p = 0. N = Total number of observed genotypes, HWE = Hardy-Weinberg equilibrium, χ² = Chi-square value, df = degree of freedom, p < 0.05 indicates statistical significance.
The IGF-1 c.335 A>T locus (n = 380) demonstrated polymorphism with genotype frequencies of AT (0.371, n = 141, 37.1%) and TT (0.629, n = 239, 62.9%), whereas the AA genotype was absent. Allele frequencies were A = 0.185 and T = 0.815. HWE analysis revealed significant deviation from equilibrium with χ² = 8.34, df = 1, and p = 0.015 (Table 5), indicating possible selection pressure or population stratification consistent with artificial insemination records at UPBS, where 68% of sires possessed the TT genotype during 2018-2023. Polymorphic information content values were 0.23 for g.820 C>T, 0.05 for g.1127 A>T, and 0.30 for c.335 A>T, indicating variable marker informativeness according to previous classification criteria [22].
| Sample | Frequency | AA (n = 0) | AT (n = 142) | TT (n = 238) | A | T |
|---|---|---|---|---|---|---|
| FH cows | Observed | 0 | 0.37 | 0.63 | 0.19 | 0.81 |
| Expected | 0.03 | 0.31 | 0.66 |
Table 5. Genotype and allele frequencies and HWE analysis of IGF-1 c.335 A>T polymorphism in FH cows.
| Sample | Frequency | AA (n = 0) | AT (n = 142) | TT (n = 238) | A | T |
|---|---|---|---|---|---|---|
| FH cows | Observed | 0 | 0.37 | 0.63 | 0.19 | 0.81 |
| Expected | 0.03 | 0.31 | 0.66 |
χ² = 8.34, df = 2, p = 0.015. N = Total number of observed genotypes, HWE = Hardy-Weinberg equilibrium, χ² = Chi-square value, df = degree of freedom, p < 0.05 indicates statistical significance.
Association of genotypes with milk production traits in FH cattle
Table 6 reveals the association of the observed genotypes on milk production. As shown, the LEP g.820 C>T locus (PCR-RFLP, Sau3AI digestion, n = 330) demonstrated substantial polymorphism with clearly distinguishable genotypes. Homozygous CC predominated at 0.752 (n = 248, 75.2%), heterozygous CT occurred at 0.233 (n = 77, 23.3%), whereas homozygous TT remained rare at 0.015 (n = 5, 1.5%). Allelic frequencies indicated dominance of the C allele (0.868, 95% CI: 0.843-0.892) compared with the T allele (0.132), exceeding the minimum polymorphism threshold. HWE analysis generated expected genotype frequencies of CC = 0.754, CT = 0.229, and TT = 0.017. The χ² goodness-of-fit test yielded χ² = 0.12, df = 1, and p = 0.73 (>0.05), indicating genetic equilibrium and population stability at this locus.
| Traits | CC (n = 248) Mean ± SE | CT (n = 77) Mean ± SE | TT (n = 5) Mean ± SE | p-value |
|---|---|---|---|---|
| DIM (days) | 337.45 ± 3.91ᵇ | 340.57 ± 5.89ᵇ | 397.12 ± 20.93ᵃ | 0.017 |
| Milk production at 305 days (kg) | 7868.30 ± 84.44 | 7904.72 ± 125.97 | 8005.10 ± 445.24 | 0.919 |
| Total yield (kg) | 8572.30 ± 116.99 | 8581.00 ± 187.17 | 10201.00 ± 691.12 | 0.066 |
| Average yield (kg) | 25.84 ± 0.26 | 25.71 ± 0.41 | 27.47 ± 1.51 | 0.532 |
| Peak yield (kg/day) | 38.85 ± 0.27 | 38.49 ± 0.47 | 40.23 ± 1.87 | 0.596 |
Table 6. Association of LEP g.820 C>T polymorphism with milk production traits in FH cattle.
| Traits | CC (n = 248) Mean ± SE | CT (n = 77) Mean ± SE | TT (n = 5) Mean ± SE | p-value |
|---|---|---|---|---|
| DIM (days) | 337.45 ± 3.91ᵇ | 340.57 ± 5.89ᵇ | 397.12 ± 20.93ᵃ | 0.017 |
| Milk production at 305 days (kg) | 7868.30 ± 84.44 | 7904.72 ± 125.97 | 8005.10 ± 445.24 | 0.919 |
| Total yield (kg) | 8572.30 ± 116.99 | 8581.00 ± 187.17 | 10201.00 ± 691.12 | 0.066 |
| Average yield (kg) | 25.84 ± 0.26 | 25.71 ± 0.41 | 27.47 ± 1.51 | 0.532 |
| Peak yield (kg/day) | 38.85 ± 0.27 | 38.49 ± 0.47 | 40.23 ± 1.87 | 0.596 |
DIM = Days in milk, SE = Standard error, n, Sample size,
* indicates significant difference at p < 0.05, a,b Values with different superscripts within the same row indicate significant differences (p < 0.05).
The LEP g.1127 A>T locus (ClaI digestion, n = 330) demonstrated constrained biallelic polymorphism with AA (0.948, n = 313, 94.8%) and AT (0.052, n = 17, 5.2%) genotypes, whereas TT genotypes were completely absent. Allele frequencies were A = 0.974 and T = 0.026. Expected HWE frequencies were AA = 0.949 and AT = 0.051, whereas χ² analysis yielded χ² = 0.21, df = 1, and p = 0.89 (Table 7), indicating equilibrium maintenance.
| Traits | AA (n = 313) Mean ± SE | AT (n = 17) Mean ± SE | p-value |
|---|---|---|---|
| DIM (days) | 339.85 ± 3.95 | 339.48 ± 11.30 | 0.974 |
| Milk production at 305 days (kg) | 7882.04 ± 79.85 | 7835.78 ± 236.28 | 0.845 |
| Total yield (kg) | 8603.30 ± 110.61 | 8602.80 ± 372.58 | 0.999 |
| Average yield (kg) | 25.88 ± 0.24 | 25.16 ± 0.81 | 0.385 |
| Peak yield (kg/day) | 38.82 ± 0.24 | 38.26 ± 0.99 | 0.586 |
Table 7. Association of LEP g.1127 A>T polymorphism with milk production traits in FH cattle.
| Traits | AA (n = 313) Mean ± SE | AT (n = 17) Mean ± SE | p-value |
|---|---|---|---|
| DIM (days) | 339.85 ± 3.95 | 339.48 ± 11.30 | 0.974 |
| Milk production at 305 days (kg) | 7882.04 ± 79.85 | 7835.78 ± 236.28 | 0.845 |
| Total yield (kg) | 8603.30 ± 110.61 | 8602.80 ± 372.58 | 0.999 |
| Average yield (kg) | 25.88 ± 0.24 | 25.16 ± 0.81 | 0.385 |
| Peak yield (kg/day) | 38.82 ± 0.24 | 38.26 ± 0.99 | 0.586 |
DIM = Days in milk, SE = Standard error, n = Sample size.
The IGF-1 c.309 G>T locus (AluI digestion, n = 380) revealed complete monomorphism with fixation of the TT genotype at 1.000 (n = 380), T allele frequency of 1.000, and absence of the G allele. Consequently, HWE testing was inapplicable because of the absence of genotypic variation (Table 4).
Meanwhile, as displayed on Table 8, the IGF-1 c.335 A>T locus (ApoI digestion, n = 380) exhibited marked polymorphism with TT (0.629, n = 239, 62.9%) and AT (0.371, n = 141, 37.1%) genotypes, whereas AA genotypes were absent. Allele frequencies were T = 0.815 and A = 0.185. Significant deviation from HWE was detected (χ² = 8.34, df = 1, p = 0.015), indicating non-random evolutionary influences [23]. This disequilibrium corresponded with artificial insemination records at UPBS showing predominant use of TT sires between 2018 and 2023 and was comparable with previously reported IGF-1 deviations in Kuantan cattle populations.
| Traits | AT (n = 142) Mean ± SE | TT (n = 238) Mean ± SE | p-value |
|---|---|---|---|
| DIM (days) | 336.26 ± 4.93 | 338.22 ± 4.12 | 0.709 |
| Milk production at 305 days (kg) | 5132.43 ± 180.24 | 5141.30 ± 159.56 | 0.958 |
| Total yield (kg) | 8722.96 ± 151.10 | 8858.60 ± 122.35 | 0.426 |
| Average yield (kg) | 41.75 ± 10.31 | 41.53 ± 10.29 | 0.828 |
| Peak yield (kg/day) | 39.67 ± 0.40 | 39.71 ± 0.32 | 0.925 |
Table 8. Association of IGF-1 c.335 A>T polymorphism with milk production traits in FH cattle.
| Traits | AT (n = 142) Mean ± SE | TT (n = 238) Mean ± SE | p-value |
|---|---|---|---|
| DIM (days) | 336.26 ± 4.93 | 338.22 ± 4.12 | 0.709 |
| Milk production at 305 days (kg) | 5132.43 ± 180.24 | 5141.30 ± 159.56 | 0.958 |
| Total yield (kg) | 8722.96 ± 151.10 | 8858.60 ± 122.35 | 0.426 |
| Average yield (kg) | 41.75 ± 10.31 | 41.53 ± 10.29 | 0.828 |
| Peak yield (kg/day) | 39.67 ± 0.40 | 39.71 ± 0.32 | 0.925 |
DIM = Days in milk, SE = Standard error, n = Sample size.
Association of genotypes with reproductive performance in FH cattle
Statistical analysis presented in Table 9 demonstrated that the LEP SNP g.820 C>T was significantly associated with major reproductive performance traits in FH cows (p < 0.05). Specifically, genetic variation at the g.820 C>T locus showed significant associations with calving interval, first insemination postpartum (FIP), days open (DO), and conception rate (CR). These findings were consistent with previous studies reporting significant relationships between LEP polymorphisms and reproductive traits, including age at first calving, A1457G SNP-associated calving interval [23], and LEP-1238 polymorphism-associated gestation length [24, 25].
| Traits | CC (n = 248) Mean ± SE | CT (n = 77) Mean ± SE | TT (n = 5) Mean ± SE | p-value |
|---|---|---|---|---|
| Calving interval (days) | 13.14 ± 0.16ᵇ | 13.22 ± 0.23ᵇ | 15.35 ± 0.79ᵃ | 0.022 |
| DFH (days) | 66.75 ± 1.16 | 65.15 ± 1.50 | 68.75 ± 4.69 | 0.404 |
| DFI (days) | 67.25 ± 1.13 | 66.04 ± 1.49 | 68.64 ± 4.79 | 0.615 |
| FIP (days) | 59.60 ± 4.00ᵇ | 62.20 ± 5.81ᵇ | 118.14 ± 20.19ᵃ | 0.015 |
| DO (days) | 130.13 ± 4.45ᵇ | 131.65 ± 6.53ᵇ | 193.89 ± 22.75ᵃ | 0.021 |
| DD (days) | 66.17 ± 1.16 | 66.24 ± 2.08 | 68.51 ± 8.05 | 0.954 |
| S/C | 2.18 ± 0.07 | 2.36 ± 0.11 | 2.90 ± 0.40 | 0.076 |
| CR (%) | 0.63 ± 0.01ᵇ | 0.58 ± 0.02ᵇ | 0.45 ± 0.08ᵃ | 0.031 |
Table 9. Association of LEP g.820 C>T polymorphism with reproductive performance traits in FH cows.
| Traits | CC (n = 248) Mean ± SE | CT (n = 77) Mean ± SE | TT (n = 5) Mean ± SE | p-value |
|---|---|---|---|---|
| Calving interval (days) | 13.14 ± 0.16ᵇ | 13.22 ± 0.23ᵇ | 15.35 ± 0.79ᵃ | 0.022 |
| DFH (days) | 66.75 ± 1.16 | 65.15 ± 1.50 | 68.75 ± 4.69 | 0.404 |
| DFI (days) | 67.25 ± 1.13 | 66.04 ± 1.49 | 68.64 ± 4.79 | 0.615 |
| FIP (days) | 59.60 ± 4.00ᵇ | 62.20 ± 5.81ᵇ | 118.14 ± 20.19ᵃ | 0.015 |
| DO (days) | 130.13 ± 4.45ᵇ | 131.65 ± 6.53ᵇ | 193.89 ± 22.75ᵃ | 0.021 |
| DD (days) | 66.17 ± 1.16 | 66.24 ± 2.08 | 68.51 ± 8.05 | 0.954 |
| S/C | 2.18 ± 0.07 | 2.36 ± 0.11 | 2.90 ± 0.40 | 0.076 |
| CR (%) | 0.63 ± 0.01ᵇ | 0.58 ± 0.02ᵇ | 0.45 ± 0.08ᵃ | 0.031 |
DFH = Days to first heat, DFI = Days to first artificial insemination, FIP = Days from first artificial insemination to pregnancy, DO = Days open, DD = Days dry, S/C = Service per conception, CR = Conception rate, SE = Standard error, n = Sample size,
* indicates significant difference at p < 0.05, a,b Values with different superscripts within the same row indicate significant differences (p < 0.05).
Conversely, statistical analysis of the LEP g.1127 A>T polymorphism in relation to reproductive performance in FH cattle (Table 10) demonstrated no significant associations (p > 0.05) with CI, day to first heat (DFH), day to first insemination (DFI), FIP, DO, days dry (DD), service per conception (S/C), or CR. These findings agreed with previous reports demonstrating that the LEP/HphI genotype was not significantly associated with age at first calving or first calving interval, supporting the limited biological influence of the g.1127 A>T locus on reproductive traits in this population [26].
| Traits | AA (n = 313) Mean ± SE | AT (n = 17) Mean ± SE | p-value |
|---|---|---|---|
| Calving interval (days) | 13.21 ± 0.16 | 13.28 ± 0.42 | 0.865 |
| DFH (days) | 66.52 ± 1.12 | 65.22 ± 2.48 | 0.586 |
| DFI (days) | 67.11 ± 1.09 | 65.54 ± 2.53 | 0.524 |
| FIP (days) | 61.06 ± 3.91 | 67.00 ± 10.83 | 0.584 |
| DO (days) | 132.18 ± 4.45 | 132.23 ± 12.29 | 0.996 |
| DD (days) | 66.26 ± 1.03 | 65.47 ± 4.44 | 0.862 |
| S/C | 2.22 ± 0.06 | 2.56 ± 0.21 | 0.128 |
| CR (%) | 0.61 ± 0.01 | 0.57 ± 0.04 | 0.343 |
Table 10. Association of LEP g.1127 A>T polymorphism with reproductive performance traits in FH cows.
| Traits | AA (n = 313) Mean ± SE | AT (n = 17) Mean ± SE | p-value |
|---|---|---|---|
| Calving interval (days) | 13.21 ± 0.16 | 13.28 ± 0.42 | 0.865 |
| DFH (days) | 66.52 ± 1.12 | 65.22 ± 2.48 | 0.586 |
| DFI (days) | 67.11 ± 1.09 | 65.54 ± 2.53 | 0.524 |
| FIP (days) | 61.06 ± 3.91 | 67.00 ± 10.83 | 0.584 |
| DO (days) | 132.18 ± 4.45 | 132.23 ± 12.29 | 0.996 |
| DD (days) | 66.26 ± 1.03 | 65.47 ± 4.44 | 0.862 |
| S/C | 2.22 ± 0.06 | 2.56 ± 0.21 | 0.128 |
| CR (%) | 0.61 ± 0.01 | 0.57 ± 0.04 | 0.343 |
DFH = Days to first heat, DFI = Days to first artificial insemination, FIP = Days from first artificial insemination to pregnancy, DO = Days open, DD = Days dry, S/C = Service per conception, CR = Conception rate, SE = Standard error, n = Sample size.
Similarly, statistical analysis presented in Table 11 revealed no significant association between the IGF-1 SNP c.335 A>T and reproductive performance traits in FH cows. Comparative analysis between AT and TT genotypes demonstrated similar mean values for CI, DFH, DFI, FIP, DO, DD, S/C, and CR, with no statistically significant differences observed (p > 0.05). These findings were consistent with previous studies reporting no association between the IGF-1 C-512T/SnaBI polymorphism and reproductive traits in Javanese Brebes cattle, further supporting the limited effect of this genetic variant on reproductive performance.
| Traits | AT (n = 142) Mean ± SE | TT (n = 238) Mean ± SE | p-value |
|---|---|---|---|
| Calving interval (days) | 12.92 ± 0.27 | 12.87 ± 0.22 | 0.853 |
| DFH (days) | 66.50 ± 1.04 | 66.46 ± 0.99 | 0.963 |
| DFI (days) | 66.89 ± 1.03 | 67.05 ± 0.98 | 0.831 |
| FIP (days) | 60.88 ± 5.01 | 62.08 ± 4.51 | 0.785 |
| DO (days) | 131.64 ± 5.60 | 134.57 ± 5.00 | 0.560 |
| DD (days) | 67.46 ± 1.75 | 66.06 ± 1.50 | 0.429 |
| S/C | 2.20 ± 0.09 | 2.36 ± 0.08 | 0.115 |
| CR (%) | 0.61 ± 0.02 | 0.60 ± 0.02 | 0.883 |
Table 11. Association of IGF-1 c.335 A>T polymorphism with reproductive performance traits in FH cows.
| Traits | AT (n = 142) Mean ± SE | TT (n = 238) Mean ± SE | p-value |
|---|---|---|---|
| Calving interval (days) | 12.92 ± 0.27 | 12.87 ± 0.22 | 0.853 |
| DFH (days) | 66.50 ± 1.04 | 66.46 ± 0.99 | 0.963 |
| DFI (days) | 66.89 ± 1.03 | 67.05 ± 0.98 | 0.831 |
| FIP (days) | 60.88 ± 5.01 | 62.08 ± 4.51 | 0.785 |
| DO (days) | 131.64 ± 5.60 | 134.57 ± 5.00 | 0.560 |
| DD (days) | 67.46 ± 1.75 | 66.06 ± 1.50 | 0.429 |
| S/C | 2.20 ± 0.09 | 2.36 ± 0.08 | 0.115 |
| CR (%) | 0.61 ± 0.02 | 0.60 ± 0.02 | 0.883 |
DFH = Days to first heat, DFI = Days to first artificial insemination, FIP = Days from first artificial insemination to pregnancy, DO = Days open, DD = Days dry, S/C = Service per conception, CR = Conception rate, SE = Standard error, n = Sample size.
DISCUSSION
DNA quality and amplification efficiency
The DNA extraction profiles obtained for the LEP and IGF-1 loci in FH cattle revealed systematic differences in band intensity and sharpness that were mechanistically consistent with variation in DNA yield and structural integrity across samples. In agarose gel electrophoresis, high-molecular-weight genomic DNA present at adequate concentration typically migrates as a compact, bright band near the top of the gel, whereas low-concentration or partially degraded DNA appears as faint bands or as a diffuse smear across a wider size range [27]. Such smearing is often a direct consequence of nuclease activity or incomplete removal of heme, proteins, and other blood-derived metabolites that can destabilize the DNA backbone during or after extraction [28, 29]. Differences in lysis efficiency, salt and detergent composition, and the stringency of protein and ribonucleic acid removal steps can further influence DNA purity, with residual contaminants interfering with subsequent PCR by inhibiting Taq polymerase, altering Mg2+ availability, or changing solution ionic strength. The presence of clear bands in the majority of FH samples indicates that the extraction protocol yielded DNA of sufficient quality and quantity to support robust amplification at the LEP and IGF-1 loci, even though a subset of samples showed suboptimal intensity, which could slightly reduce amplification efficiency and downstream band brightness [29].
Amplification of LEP and IGF-1 loci
The successful amplification of LEP (g.820 C>T and g.1127 A>T) and IGF-1 (c.309 G>T and c.335 A>T) fragments at their expected sizes reflects a carefully optimized interaction among template quality, primer design, and thermal cycling conditions. In molecular terms, the presence of single, discrete bands at 422, 467, 290, and 234 bp indicates that the primers had high sequence complementarity and balanced GC content relative to their target regions, minimizing secondary structures such as hairpins and primer-dimers that commonly generate non-specific products [30, 31]. The annealing temperature was tuned to a narrow range below the primer melting temperature, allowing stable hybridization only when full-length Watson-Crick pairing occurred at the intended genomic sites. Temperatures below this optimal range increase the probability of mismatched binding and off-target amplification, whereas higher temperatures destabilize primer-template duplexes and can yield weak or absent bands [32]. In addition, the cycle number likely remained within the exponential phase of PCR, where amplicon yield is proportionate to initial template copy number and reagent concentrations have not yet become limiting. Mechanistically, these conditions enhance specificity for the LEP and IGF-1 loci and reduce background amplification from repetitive or homologous regions elsewhere in the bovine genome [33].
PCR-RFLP patterns and genotype discrimination
The PCR-RFLP patterns observed after restriction digestion provided direct molecular evidence of nucleotide polymorphisms at the targeted LEP and IGF-1 sites, as restriction enzymes recognize short sequence-specific motifs and cleave DNA only when these motifs are intact [34]. For LEP g.820 C>T, the coexistence of three genotypes, CC, CT, and TT, corresponded to three distinct fragment patterns. CC animals retained the wild-type restriction site and produced fully digested fragments of predictable lengths, TT animals lacked the site and showed the alternative digestion pattern, and CT heterozygotes displayed fragments representing both alleles in the genome [35]. A similar principle applies to LEP g.1127 A>T, where the absence of the TT genotype in the current FH cohort may indicate a low allele frequency or historical selection against TT carriers, which could reduce its representation in the population and should be further explored by expanding sample size or examining additional herds [36, 37]. In contrast, the monomorphic pattern at IGF-1 c.309 G>T indicates that the restriction site-altering mutation is either fixed or extremely rare in this population, such that all individuals carry the same allele and produce identical digestion fragments. This reflects a lack of functional variation at the specific recognition sequence for the enzyme used, although variation may still exist at other positions within IGF-1 or its regulatory regions [38, 39].
HWE and population genetic interpretation
The HWE analysis in this study revealed that the IGF-1 loci, particularly c.335 A>T, deviated significantly from equilibrium, indicating that the observed genotype frequencies differed from those expected under random mating in an ideal, non-evolving population [40]. From a population genetic standpoint, such disequilibrium implies that at least one core Hardy-Weinberg assumption was violated, including large population size, random mating with respect to the locus, absence of mutation, no migration, or no selection [41]. In the context of a managed FH herd, plausible biological drivers include directional or stabilizing selection on IGF-1-related production and fertility traits, non-random mating due to preferential use of selected sires, or subtle population substructure arising from distinct sire lines or imported germplasm, each of which can systematically alter genotype proportions at specific loci without necessarily changing overall allele frequencies in a single generation [42, 43]. Over multiple generations, these processes may contribute to microevolutionary change, with shifts in genotype and allele distribution at IGF-1 reflecting ongoing responses to selection and management decisions linked to lactation performance, energy balance, and reproductive efficiency [44].
In contrast, the LEP SNPs g.820 C>T and g.1127 A>T did not depart significantly from HWE expectations, suggesting that the FH population approximates genetic equilibrium at these loci [45]. Mechanistically, this pattern is consistent with a relatively large effective population size, quasi-random mating with respect to LEP, and the absence of strong directional selection targeting these SNPs, despite leptin is physiologically important role in energy balance and reproduction [46]. It is also possible that any selection acting on LEP in this herd is weak, balanced by opposing forces, or acting on other linked variants rather than directly on g.820 C>T and g.1127 A>T, allowing genotype frequencies to remain close to equilibrium despite ongoing breeding. Maintaining HWE at these loci is useful in practical breeding because it indicates genetic stability and predictability in allele transmission, which facilitates the use of these markers in genomic evaluation and conservation strategies without severe confounding from inbreeding or recent bottlenecks [47].
Association of IGF-1 polymorphisms with milk production
The lack of a significant association between the IGF-1 c.335 A>T SNP and milk production in FH cattle suggests that, in this population, allelic variation at this locus has little or no detectable effect on lactational performance. This finding is consistent with several studies in which most IGF-1 polymorphisms showed no meaningful relationship with milk yield, except for specific promoter or intronic variants such as rs29004509 C>T or C−512T [9, 48]. Mechanistically, c.335 A>T may be located in a region with limited regulatory impact or may have a very small effect size on IGF-1 expression, and any possible influence may be further obscured by environmental noise, polygenic control, and breed-specific linkage disequilibrium patterns that differ from those reported in Polish Red-and-White or other cattle populations [48]. At the physiological level, IGF-1 remains a key component of the growth hormone–IGF axis, coordinating mammary epithelial proliferation and differentiation and acting with estrogen, prolactin, and transforming growth factor-alpha during lactogenesis. However, these complex endocrine interactions indicate that milk yield variation is distributed across many loci and pathways, so not every IGF-1 SNP will be a useful marker. This underscores the need for population-specific validation before incorporating IGF-1 variants into selection programs [49, 50].
Functional relevance of LEP and IGF-1 polymorphisms
From a broader mechanistic standpoint, the observed polymorphisms at LEP g.820 C>T, LEP g.1127 A>T, and IGF-1 c.335 A>T may influence gene function through several routes depending on genomic context. If these SNPs are located within coding regions, they may result in synonymous or non-synonymous substitutions that alter amino acid sequence, protein folding, or receptor-binding affinity [51]. In non-coding or regulatory regions, they may affect transcription factor binding, messenger ribonucleic acid splicing efficiency, or transcript stability [52]. For LEP, allelic differences that modulate hormone expression or secretion may alter energy homeostasis, adiposity, and reproductive signaling, which in turn could influence milk yield, calving interval, and CR through changes in metabolic status and endocrine feedback at the hypothalamic-pituitary-ovarian axis [53–55]. Similarly, IGF-1 polymorphisms may alter circulating or local IGF-1 availability, affecting mammary gland development, folliculogenesis, and luteal function through downstream cellular signaling pathways [56]. The HWE status of each locus further reflects whether evolutionary forces such as selection for high milk yield or improved fertility have already shaped allele frequencies. Loci in equilibrium likely experience weak or balanced selection, whereas loci deviating from equilibrium may be undergoing active selection, drift in substructured populations, or non-random mating favoring specific genotypes [57].
Implications for MAS
The associations reported between LEP g.820 C>T genotypes and both productive and reproductive traits can be interpreted as phenotypic manifestations of these molecular mechanisms, whereby LEP variation fine-tunes the integration of nutritional status, lactation demand, and reproductive axis activation in FH cows [58, 59]. Conversely, the absence of significant associations for LEP g.1127 A>T and IGF-1 c.335 A>T may reflect genuinely minor or context-dependent functional effects, insufficient statistical power due to rare genotypes, or confounding environmental and management factors that obscure true genotype-phenotype relationships [60–62]. Overall, the combined DNA quality assessment, PCR optimization, and PCR-RFLP genotyping results indicate that the molecular workflow used in this study was technically robust and biologically coherent, providing a sound basis for interpreting the genetic association analyses and refining MAS strategies in FH breeding programs.
CONCLUSION
This study demonstrated that the LEP g.820 C>T polymorphism was significantly associated with several economically important productive and reproductive traits in Indonesian FH cattle, particularly days in milk, calving interval, FIP, days open, and CR. Cows carrying the CC genotype exhibited superior reproductive performance compared with TT genotype carriers, indicating the potential functional relevance of this locus in regulating fertility-related physiological pathways. In contrast, LEP g.1127 A>T showed limited polymorphism and no significant association with productive or reproductive parameters. Similarly, the IGF-1 c.309 G>T locus was monomorphic in the evaluated population, whereas IGF-1 c.335 A>T exhibited polymorphism but did not show significant relationships with milk production or reproductive traits.
The present findings provide important practical implications for dairy cattle breeding programs in Indonesia. The significant associations observed for LEP g.820 C>T suggest that this polymorphism may serve as a promising molecular marker for MAS aimed at improving reproductive efficiency and overall herd productivity in tropical FH populations. Incorporating validated genomic markers into conventional breeding systems may improve selection accuracy, accelerate genetic gain, and support sustainable dairy production under Indonesian commercial management conditions.
One major strength of this study was the relatively large sample population derived from a commercial dairy production system, which increased the reliability and practical relevance of the genetic association analyses. In addition, the integration of molecular genotyping, HWE analysis, productive traits, and reproductive performance evaluations provided a comprehensive assessment of candidate gene effects under tropical production conditions. The use of PCR-RFLP genotyping with high-quality DNA extraction and reproducible amplification protocols further strengthened the robustness of the molecular analyses.
However, several limitations should be acknowledged. The study population originated from a single commercial herd, which may limit the generalizability of the findings to broader Indonesian dairy populations. Some genotypes, particularly TT carriers at the LEP g.820 C>T locus, occurred at very low frequencies, potentially reducing statistical power for genotype comparisons. Furthermore, milk production and reproductive traits are polygenic and strongly influenced by environmental, nutritional, and management factors that may interact with genetic effects and contribute to unexplained phenotypic variation.
Future studies should therefore include larger multi-herd populations representing diverse geographic and management conditions across Indonesia to validate the consistency of these associations. Additional investigations involving high-throughput genomic approaches, haplotype analyses, gene expression studies, and genome-wide association studies may further clarify the biological mechanisms underlying productive and reproductive performance in FH cattle. Exploration of genotype × environment interactions and integration of multiple candidate genes into genomic prediction models may also improve the development of precision breeding strategies for tropical dairy systems.
Overall, the findings of this study indicate that the LEP g.820 C>T polymorphism has potential utility as a molecular marker for improving reproductive and productive performance in Indonesian FH cattle, whereas the evaluated IGF-1 polymorphisms demonstrated limited applicability in this population. These results contribute valuable molecular genetic information that may support the implementation of genomic-assisted breeding programs for sustainable dairy cattle improvement in Indonesia.
DATA AVAILABILITY
The supplementary data can be made available from the corresponding author upon request.
AUTHORS’ CONTRIBUTIONS
AP: Conceptualization, formal analysis, methodology, project administration, supervision, validation, visualization, writing – original draft, and writing – review and editing. MC: Conceptualization, methodology, supervision, validation, visualization, writing – original draft, and writing – review and editing. AHT: Data curation, investigation, software, visualization, and writing – original draft. HF: Data curation, investigation, software, and writing – original draft. IRA: Data curation, formal analysis, investigation, software, and writing – original draft. SR: Data curation, formal analysis, investigation, software, and writing – original draft. FHB: Formal analysis, validation, software, and writing – review and editing. All authors have read and approved the final manuscript.
COMPETING INTERESTS
The authors declare that they have no competing interests.
PUBLISHER’S NOTE
Veterinary World remains neutral with regard to jurisdictional claims in the published institutional affiliations.
ACKNOWLEDGMENTS
This study was fully supported by the Ministry of Education, Culture, Research, and Technology of the Republic of Indonesia under the National Competitive Research Grant – Regular Fundamental Scheme (Contract Number: 086/E5/PG.02.00/PL/2024). The authors gratefully acknowledge the Molecular Genetics and Biotechnology Research Team, Universitas Sebelas Maret, Surakarta, Indonesia, for their invaluable technical expertise and assistance in molecular analyses and data interpretation throughout this study. The authors also express sincere appreciation to Mr. Suryo Firmanto, Farm Manager of PT UPBS, Pangalengan, Kabupaten Bandung, Jawa Barat, Indonesia, and all staff members of PT UPBS for their invaluable assistance, cooperation, and logistical support during the research period. Their contribution was essential for facilitating sample collection, herd management coordination, and field data acquisition.
REFERENCES
- Saleh AA, Easa AA, El-Hedainy DK, Rashad AM. Prediction of some milk production traits using udder and teat measurements with a spotlight on their genetic background in Friesian cows. Sci Rep 2023;13(1):16193. [Google Scholar] | [Crossref]
- Produksi susu segar menurut provinsi 2022. Jakarta Pusat: Badan Pusat Statistik; 2022. [Google Scholar]
- Abd-El Hamed AM, Kamel ER. Effect of some non-genetic factors on the productivity and profitability of Holstein Friesian dairy cows. Vet World 2021;14(1):242. [Google Scholar] | [Crossref]
- Sebastiani C, Arcangeli C, Torricelli M, Ciullo M, D'Avino N, Cinti G. Marker-assisted selection of dairy cows for β-casein gene A2 variant. Ital J Food Sci 2022;34(2):21. [Google Scholar] | [Crossref]
- Rotwein P. Diversification of the insulin-like growth factor 1 gene in mammals. PLoS One 2017;12(12):e0189642. [Google Scholar] | [Crossref]
- Saleh AA, Hassan TG, El-Hedainy DK, El-Barbary AS, Sharaby MA, Hafez EE. IGF-I and GH genes polymorphism and their association with milk yields, composition and reproductive performance in Holstein-Friesian dairy cattle. BMC Vet Res 2024;20(1):341. [Google Scholar] | [Crossref]
- Al-Samerria S, Radovick S. The role of insulin-like growth factor-1 (IGF-1) in the control of neuroendocrine regulation of growth. Cells 2021;10(10):2664. [Google Scholar] | [Crossref]
- Oberlender G, Murgas LDS, Zangeronimo MG, Silva AC, Menezes TA, Pontelo TP. Role of insulin-like growth factor-I and follicular fluid from ovarian follicles with different diameters on porcine oocyte maturation and fertilization in vitro. Theriogenology 2013;80(4):319-327. [Google Scholar] | [Crossref]
- Dar MR, Singh M, Thakur S, Verma A. Exploring the relationship between polymorphisms of leptin and IGF-1 genes with milk yield in indicine and taurine crossbred cows. Trop Anim Health Prod 2021;53(4):413. [Google Scholar] | [Crossref]
- Ozdemir M, Karaca S. A meta-analysis on the relationship between IGF-1 gene polymorphism and milk production traits in cattle. J Hellenic Vet Med Soc 2025;76(1):8607-8626. [Google Scholar] | [Crossref]
- Al-Hussaniy HA, Alburghaif AH, Naji MA. Leptin hormone and its effectiveness in reproduction, metabolism, immunity, diabetes, hopes and ambitions. J Med Life 2021;14(5):600. [Google Scholar] | [Crossref]
- Kaniamuthan S, Manimaran A, Kumaresan A, Wankhade PR, Karuthadurai T, Sivaram M. Biochemical indicators of energy balance in blood and other secretions of dairy cattle: A review. Agric Rev 2025;46(2). [Google Scholar] | [Crossref]
- Shaarawy AM, Mohamed MY, Sayah MS, Mehany AA, El-Beltagi EAA, Ali SM. The relationship between Friesian calves performance and growth hormone and leptin levels. Adv Anim Vet Sci 2024;12(11):2069-2084. [Google Scholar] | [Crossref]
- Kibar M, Aytekin İ. Lack of evidence for association between the leptin/Sau3AI gene and milk yield traits in Holstein Friesian dairy cattle. J Dairy Res 2023;90(4):339-342. [Google Scholar] | [Crossref]
- El-Shorbagy HM, Abdel-Aal ES, Mohamed SA, El-Ghor AA. Association of PRLR, IGF1, and LEP genes polymorphism with milk production and litter size in Egyptian Zaraibi goat. Trop Anim Health Prod 2022;54(5):321. [Google Scholar] | [Crossref]
- Setiawanti STSW, Susilorini TE, Wahjuningsih S, Kuswati K, Suyadi S. Reproductive performance of Indonesian Friesian Holstein dairy cattle across lactation periods: A case study at TIU-LBF Batu, Indonesia. Adv Anim Vet Sci 2025;13(8):1708-1715. [Google Scholar] | [Crossref]
- Nei M, Kumar S. Molecular evolution and phylogenetics. New York: Oxford University Press; 2000. [Google Scholar]
- Lee J, Kim HJ, Lee SS, Kim KW, Kim DK, Lee SH. Effects of diet and castration on fatty acid composition and volatile compounds in the meat of Korean native black goats. Anim Biosci 2023;36(6):962. [Google Scholar] | [Crossref]
- Kim EH, Kang HC, Sun DW, Myung CH, Kim JY, Lee DH. Estimation of breeding value and accuracy using pedigree and genotype of Hanwoo cows (Korean cattle). J Anim Breed Genet 2022;139(3):281-291. [Google Scholar] | [Crossref]
- Szewczuk MA, Oster N, Stankiewicz T, Blaszczyk B, Golebowska A. Candidate genetic markers related to milk production characteristics and technological suitability of milk. Folia Pomeranae Univ Technol Stetin Agric Aliment Piscaria Zootech 2025;73(1):374. [Google Scholar] | [Crossref]
- Wahyudi I. Identifikasi keragaman gen insulin-like growth factor-1 pada sapi Kuantan menggunakan metode PCR-RFLP [doctoral dissertation]. Riau: Universitas Islam Negeri Sultan Syarif Kasim; 2022. [Google Scholar]
- Metin Kiyici J, Arslan K, Akyuz B, Kaliber M, Aksel EG, Çinar MU. Relationships between polymorphisms of growth hormone, leptin and myogenic factor 5 genes with some milk yield traits in Holstein dairy cows. Int J Dairy Technol 2019;72(1):1-7. [Google Scholar] | [Crossref]
- Chouhan H, Pannu U, Joshi RK, Nehara M. Study of milk production genes and their association with production traits in Rathi cattle. Indian J Anim Sci 2023;93(1):62-66. [Google Scholar] | [Crossref]
- Czerniawska-Piątkowska E, Szatkowska I, Zaborski D, Grzesiak W, Tabor-Osińska S, Wasielewska M. Single nucleotide polymorphism in the promoter region of the IGF-I gene is associated with milk production in Holstein and Jersey cattle-is the aspect of present research still relevant in the era of genomic selection. Pak J Zool 2021;53(6):2295. [Google Scholar] | [Crossref]
- Prihandini PW, Hariyono DNH, Sari APZNL, Tribudi YA, Ibrahim A, Luthfi M. Association between GH, PRL, LEP, and PIT-1 gene polymorphisms and growth traits in Indonesian Rambon indigenous cattle. Trop Anim Health Prod 2025;57(2):56. [Google Scholar] | [Crossref]
- Dandapat A, Kumar D, Ghosh AK, Banerjee D. Association of leptin gene polymorphism with growth, milk production and reproduction traits in Sahiwal and crossbred cattle. Indian J Anim Sci 2009;79(9):892-896. [Google Scholar] | [Crossref]
- Barido FH, Desti D, Pramono A, Abdurrahman ZH, Volkandari SD, Cahyadi M. Validating duplex-PCR targeting ND2 for bovine and porcine detection in meat products. Food Chem Mol Sci 2023;7:100181. [Google Scholar] | [Crossref]
- Cahyadi M, Puruhita, Barido FH, Hertanto BS. Specific primer design of mitochondrial 12S rRNA for species identification in raw meats. IOP Conf Ser Earth Environ Sci 2018;102:012038. [Google Scholar] | [Crossref]
- Wijekoon WMSUK, Nishantha KMDWP, De Costa DM. Comparison of DNA extraction protocols for molecular identification of root knot nematode (Meloidogyne spp.) using egg masses. Trop Agric Res 2021;32(3). [Google Scholar] | [Crossref]
- Anggreni LD, Dewi NMRK, Mahardika IGNK, Putra IGNN. Optimization of primer concentration and annealing temperature in PCR test method for African swine fever virus detection. Bull Vet Udayana 2024;16(1):218-224. [Google Scholar] | [Crossref]
- Wang X, Liu Y, Liu H, Pan W, Ren J, Zheng X. Recent advances and application of whole genome amplification in molecular diagnosis and medicine. MedComm 2022;3(1):e116. [Google Scholar] | [Crossref]
- Khodakov D, Li J, Zhang JX, Zhang DY. Highly multiplexed rapid DNA detection with single-nucleotide specificity via convective PCR in a portable device. Nat Biomed Eng 2021;5(7):702-712. [Google Scholar] | [Crossref]
- Cahyadi M, Hasan AI, Sakti DS, Nissa NA, Pramono A, Firmanto S. Exonic mutations of POU1F1 are associated with milk pH in high-producing Holstein Friesian cows. Vet World 2024;17(10):2304. [Google Scholar] | [Crossref]
- Ilmi AM, Rahmaniar M, Permana MI. Design and optimization of PCR-RFLP assay for detection of G9053A and T15663C mutation in mitochondrial DNA. Res J Chem Environ 2023;27:1-5. [Google Scholar] | [Crossref]
- Susilawati S. Keragaman genetik gen insulin-like growth factor-1 (IGF1/SnaBI) pada sapi Pesisir dan sapi Simmental menggunakan metode PCR-RFLP [dissertation]. Padang: Fakultas Peternakan, Universitas Andalas; 2017. [Google Scholar]
- Lingaiah K, Lokanath S, Iyengar P, Gowda H, Shanmugam Manthira M, Kudupaje Bairappa C. Analysis of genetic variability among bivoltine and multivoltine silkworm genotypes using inter simple sequence repeat and simple sequence repeat markers. Nucleus 2024;67(2):385-394. [Google Scholar] | [Crossref]
- Martin NS, Ahnert SE. Insertions and deletions in the RNA sequence-structure map. J R Soc Interface 2021;18(183):20210380. [Google Scholar] | [Crossref]
- Kuswati K, Furqon A, Septian WA, Susilawati T. Polymorphism of leptin gene (single nucleotide polymorphism c.73T>C) and its association with body weight and body measurements in Madura cattle. Vet World 2022;15(3):775. [Google Scholar] | [Crossref]
- Trujano-Chavez MZ, Valerio-Hernández JE, López-Ordaz R, Ruíz-Flores A. Minor allele frequency in genomic prediction for growth traits in Braunvieh cattle. Rev Bio Cienc 2021;8. [Google Scholar] | [Crossref]
- Gupta P. Population genetics. Singapore: Springer Nature Singapore; 2022. p. 1077-1103. [Google Scholar]
- Afriani T, Purwati E, Hellyward J, Jaswandi J, Mundana M, Farhana A. Identification of single nucleotide polymorphism in early exon 10 of follicle stimulating hormone receptor (FSHR) gene in Pesisir cattle. J Ilmiah Peternak Terpadu 2022;10(3):264-276. [Google Scholar] | [Crossref]
- Campbell R, Mitchell. Biologi jilid 2. Jakarta: Erlangga; 2003. [Google Scholar]
- Ament-Velásquez SL, Gilchrist C, Rêgo A, Bendixsen DP, Brice C, Grosse-Sommer JM. The dynamics of adaptation to stress from standing genetic variation and de novo mutations. Mol Biol Evol 2022;39(11):msac242. [Google Scholar] | [Crossref]
- Lachance J. Hardy-Weinberg equilibrium and random mating. Encycl Evol Biol 2016:208-211. [Google Scholar] | [Crossref]
- Anton I, Kovacs K, Hollo G, Farkas V, Szabo F, Egerszegi I. Effect of DGAT1, leptin and TG gene polymorphisms on some milk production traits in different dairy cattle breeds in Hungary. Arch Anim Breed 2012;55(4):307-314. [Google Scholar] | [Crossref]
- Semerci EŞ, Balcioğlu MS. The effects of κ-casein, β-lactoglobulin, prolactin and DGAT1 polymorphisms on milk yields in Turkish Holstein cows. Turk J Vet Anim Sci 2022;46(1):9-17. [Google Scholar] | [Crossref]
- Sadeghi M, Babak MMS, Rahimi G, Javaremi AN. Effect of leptin gene polymorphism on the breeding value of milk production traits in Iranian Holstein. Animal 2008;2(7):999-1002. [Google Scholar] | [Crossref]
- Polasik D, Gorecka E, Wojdak-Maksymiec K. Association between IGF-1 gene polymorphism and milk production traits in Polish Red-and-White cattle. Indian J Anim Sci 2014;84(11):1241-1243. [Google Scholar] | [Crossref]
- Hannan FM, Elajnaf T, Vandenberg LN, Kennedy SH, Thakker RV. Hormonal regulation of mammary gland development and lactation. Nat Rev Endocrinol 2023;19(1):46-61. [Google Scholar] | [Crossref]
- Jena MK, Khan FB, Ali SA, Abdullah A, Sharma AK, Yadav V. Molecular complexity of mammary gland development: A review of lactogenic differentiation in epithelial cells. Artif Cells Nanomed Biotechnol 2023;51(1):491-508. [Google Scholar] | [Crossref]
- Nigam R, Pandey V, Singh P, Singh SP, Sharma D. Genetic polymorphism of leptin gene in relation with reproduction traits in Hariana cows. J Anim Res 2017;7(3):425-429. [Google Scholar] | [Crossref]
- Childs GV, Odle AK, MacNicol MC, MacNicol AM. The importance of leptin to reproduction. Endocrinology 2021;162(2):bqaa204. [Google Scholar] | [Crossref]
- Wołodko K, Šentjurc T, Walewska E, Laniecka E, Jura M, Galvão A. Increased susceptibility to diet-induced obesity in female mice impairs ovarian steroidogenesis: The role of elevated leptin signalling on nodal activity inhibition in theca cells. Mol Metab 2025;91:102062. [Google Scholar] | [Crossref]
- Goodman RL, Herbison AE, Lehman MN, Navarro VM. Neuroendocrine control of gonadotropin-releasing hormone: Pulsatile and surge modes of secretion. J Neuroendocrinol 2022;34(5):e13094. [Google Scholar] | [Crossref]
- Hartanto S, Budiyanto A, Widayanti R, Setyawan EMN, Prasetya ID. Characterization of polymorphisms in the follicle-stimulating hormone receptor and insulin-like growth factor-1 genes and their association with fertility traits in Jawa-Brebes cows. Vet World 2023;16(4):7-11. [Google Scholar] | [Crossref]
- Hax LT, Schneider A, Jacometo CB, Mattei P, Silva TC, Farina G. Association between polymorphisms in somatotropic axis genes and fertility of Holstein dairy cows. Theriogenology 2017;88:67-72. [Google Scholar] | [Crossref]
- Anggraeni A, Talib C, Asmarasari SA, Herawati T, Andreas E. Genetic polymorphisms of IGF1, GH, and OPN genes in crosses Peranakan Ongole cattle based on birth type in Central Java. J Ilmu Ternak Vet 2018;22(4):165-172. [Google Scholar] | [Crossref]
- Valencia CPL, Franco LÁÁ, Herrera DH. Association of single nucleotide polymorphisms in the CAPN, CAST, LEP, GH, and IGF-1 genes with growth parameters and ultrasound characteristics of the Longissimus dorsi muscle in Colombian hair sheep. Trop Anim Health Prod 2022;54(1):82. [Google Scholar] | [Crossref]
- Gerasimov NP, Dzhulamanov KM, Lebedev SV, Kolpakov VI. Effect of IGF-1 C472T, GH C2141G, and GHR T914A polymorphisms on growth performance and feed efficiency in young Kazakh white-headed cattle. Vet World 2023;16(8):1584. [Google Scholar] | [Crossref]
- Wathes DC, Becker F, Buggiotti L, Crowe MA, Ferris C, Foldager L. Associations between circulating IGF-1 concentrations, disease status and the leukocyte transcriptome in early lactation dairy cows. Ruminants 2021;1(2):147-177. [Google Scholar] | [Crossref]
- Bioletto F, Varaldo E, Gasco V, Maccario M, Arvat E, Ghigo E. Central and peripheral regulation of the GH/IGF-1 axis: GHRH and beyond. Rev Endocr Metab Disord 2025;26(3):321-342. [Google Scholar] | [Crossref]
- Shuang T, Fu M, Yang G, Huang Y, Qian Z, Wu L. Interaction among estrogen, IGF-1, and H2S on smooth muscle cell proliferation. J Endocrinol 2021;248(1):17-30. [Google Scholar] | [Crossref]