

ABSTRACT
Background and Aim: The gut microbiota is essential for nutrient digestion, immune function, and environmental adaptation in ruminants, particularly high-altitude species like yaks (
Materials and Methods: Fecal samples were collected from healthy ~2-year-old yaks (n=5 CY, n=5 FY) in Litang County, Ganzi Prefecture, Sichuan, China, during summer. DNA was extracted, and the V4 region of the
Results: α-Diversity indices (e.g., Shannon p = 0.5476) showed no significant differences between CY and FY. However, β-diversity revealed distinct community structures (PCoA: PC1 30.52%, PC2 12.25%; ANOSIM R = 0.976,
Conclusion: Husbandry practices profoundly influence yak gut microbiome structure and inferred metabolic potential, with free-range systems promoting, homogeneous communities suited to natural high-fiber diets while captive systems promotes fermentative and opportunistic shifts. These microbiome differences suggest opportunities for probiotic interventions to enhance yak health, productivity, and sustainability in high-altitude pastoral systems. Future metagenomic and metabolomic validation is needed.
Keywords: Yak (
INTRODUCTION
The yak (
The gut microbiota is important for ruminant digestion, nutrient utilization, immune regulation, and adaptation to environmental stress. It contributes by breaking down complex plant fibers and proteins into key nutrients for the host [6]. However, microbial composition may be affected by various factors, such as age, season, nutrition, and environment, with diet being the most influential factor [7]. Different husbandry practices (free-range and captive breeding) may also alter gut microbiota composition, thereby affecting the host’s metabolic growth and development [8].
Comparative studies have demonstrated that yak gut microbiome diversity varies with both geographic region and feeding system. Geographic differences have been linked to marked shifts in microbial composition, with
Metagenomic analyses of ruminant gut microbiomes have also revealed the presence of pathogenic bacteria and antimicrobial resistance genes, which pose risks to both animal health and food safety. Pathogens, such as
Despite these insights, current findings on the gut microbiome of
Therefore, the present study aimed to compare the gut microbial composition, diversity patterns (including α- and β-diversity), and predicted functional profiles between CY and FY in the same geographic region using high-throughput 16S rRNA gene sequencing. By combining taxonomic profiling with functional predictions via PICRUSt2 (KEGG pathways), BugBase (community phenotypes), and FAPROTAX (ecological functions), we sought to elucidate how husbandry practices shape the yak gut microbiome and to provide foundational insights for optimizing diet, health, and productivity in high-altitude yak production systems.
MATERIALS AND METHODS
Ethical approval
All procedures in this study were conducted in accordance with the ethical guidelines of Sichuan Minzu College and the relevant national standards for animal welfare in China (including GB/T 35892-2018: Laboratory Animal – Guideline for Ethical Review of Animal Experiments). The study was purely observational and non-invasive, involving only the collection of fresh fecal samples from the ground or spontaneously defecated material without any physical restraint, handling, capture, anesthesia, or intervention that could cause harm, pain, distress, or behavioral alteration to the
Given the non-invasive nature of fecal collection (which did not involve direct animal contact beyond observation from a distance and posed no risk to animal welfare), formal ethical review or approval by an Institutional Animal Care and Use Committee or equivalent ethics committee was not required under Sichuan Minzu College guidelines and applicable Chinese regulations for such low-risk, non-experimental livestock studies.
Informed consent was obtained from all yak owners/herders prior to sample collection. Consent was documented verbally and in writing (in Tibetan and Mandarin as appropriate), with full explanation of the study’s purpose, methods, non-invasive approach, potential benefits for yak health and husbandry, data confidentiality, and voluntary participation (Supplement 3 for consent templates and records). No compensation was provided, and owners retained the right to withdraw consent at any time.
This approach complies with international best practices for non-invasive research on the microbiomes of wildlife and livestock, including principles from the ARRIVE 2.0 guidelines (for reporting animal research) and recommendations from the World Organisation for Animal Health Terrestrial Animal Health Code on minimizing animal disturbance. All sampling was performed by trained personnel using sterile techniques to prevent contamination and environmental impact. The study adhered to the 3Rs principle (Replacement, Reduction, Refinement) by using non-invasive methods and limiting sample size to the minimum required for scientific validity.
Sample collection
Fecal samples were collected from yaks raised in Li Tang County, Ganzi Tibetan Autonomous Prefecture, Sichuan, China, in June (summer season). During sampling, the local climate was characterized by cool alpine summer conditions (typical temperature range: 8°C–18°C) with abundant natural forage growth.
Captive yaks were sampled at 100°17′9.600′′E, 29°58′55.200′′N (average elevation: 3908.0 m; Li Tang Yak Eco-industry Yak Park), and free-range yaks were sampled at 100°21′3.600′′E, 29°48′43.200′′N (average elevation: 3831.5 m). All animals originated from a single herd within their respective systems. Free-range yaks co-grazed on a shared alpine pasture, dominated by natural forage species typical of the region (
The captive diet consisted primarily of green hay (the main roughage source) supplemented with feed made from corn and soybean meal, reflecting the typical nutrient composition of local captive yak production. Although detailed chemical composition (DM, CP, NDF, ADF, and minerals) was not available from the farm records, all animals within the captive system received the same feed batch.
Because the animals belonged to local herder-owned production systems rather than controlled experimental herds, detailed metadata, including body weight, body condition score, sex, vaccination history, deworming records, parasite screening, and recent antibiotic use, were not recorded by the owners. However, all selected animals were approximately 2 years old, belonged to the same herd, and showed no visible signs of illness, diarrhea, or injury at the time of sampling. Only animals that were judged healthy by the herders were included.
A total of 10 fresh fecal samples were collected (n = 5 captive; n = 5 free-range). Sampling occurred between 9:00 and 10:00 a.m. The outer fecal surface of each sample was removed using a sterile cotton swab, and a new sterile swab was used to collect fecal material from the inner portion to minimize environmental contamination. The samples were placed immediately into sterile 2-mL tubes. The samples were transported to the laboratory on dry ice and stored at −80°C until DNA extraction. All samples were simultaneously processed to avoid batch effects.
DNA extraction and polymerase chain reaction amplification
Total genomic DNA was extracted from fecal samples using the HiPure Stool DNA Mini Kit (Magen Company, Guangzhou, China) according to the manufacturer’s protocol. DNA integrity was examined by agarose gel electrophoresis, and the concentrations were quantified using a Qubit 3.0 fluorometer (Thermo Fisher Scientific, Waltham, MA, USA).
The bacterial
Bioinformatics analysis
Preprocessing of the raw reads
The quality control of raw paired-end reads was performed using FASTP (version 0.18.0). Reads were removed if they contained ≥10% ambiguous bases (N), showed adapter contamination, or had more than 50% of bases with a Phred quality score ≤20. Paired-end reads passing quality filters were merged into tags using FLASH v1.2.11 with a minimum overlap of 10 bp and a maximum mismatch rate of 2% [14]. Raw tags were further filtered by truncating sequences at the first position where three consecutive bases had Q ≤3, and tags were discarded if the remaining high-quality region accounted for <75% of the total length. Clean high-quality tags were retained for downstream analysis [15].
Operational taxonomic units (OTU) clustering and taxonomic assignment
OTUs were clustered at 97% similarity using the UPARSE algorithm in USEARCH v11.0.667, and the most abundant sequence within each OTU was selected as the representative sequence [16]. UCHIME was used to identify and remove chimeric sequences. The RDP Classifier v2.2 was used to perform taxonomic annotation against the SILVA
Analysis of diversity and functional prediction
Alpha-diversity indices, including Chao1, ACE, Shannon, Simpson, and Good’s coverage, were calculated in R (version 4.3.1) using standard equations referenced from Mothur. Rarefaction curves and rank–abundance curves were generated using the ggplot2 package (version 3.2.1) in R to evaluate sequencing depth and community evenness. Beta-diversity analysis was conducted based on unweighted UniFrac distance to assess phylogeny-based differences in microbial community composition, and PCoA was performed using the vegan package (version 2.5.6) in R [18]. For functional prediction, PICRUSt2 (version 2.5.3) was used to predict microbial metabolic functions based on the KEGG database. To improve prediction reliability, samples with Nearest Sequenced Taxon Index values greater than 2 were excluded. Microbial phenotypes were predicted using BugBase (version 1.0), and FAPROTAX (version 1.2.4) was used to annotate ecological functions.
Statistical analysis
All statistical analyses were performed in R and the Omicsmart online platform. Alpha-diversity indices and taxonomic relative abundances were compared between groups using Welch’s t-tests (two-tailed), with statistical significance set at p < 0.05. Multivariate analyses were performed using PCoA based on distance matrices, and ANOSIM with 999 permutations was applied to evaluate differences in community structure between groups. Spearman correlation coefficients were calculated for network analysis to construct co-occurrence networks. Correlations with p < 0.05 were retained, and the top 50 strongest correlation pairs were visualized using the Omicsmart platform’s dynamic interactive data analysis tools. When the data did not meet the normality assumptions, the non-parametric Wilcoxon rank-sum tests were applied as appropriate.
RESULTS
Data collection and OTU analysis
Amplicon sequencing on 10 collected yak fecal samples yielded 1,288,404 raw sequences (CY = 650,001, FY = 638,403) (Table 1). After quality assessment and data filtering, a total of 1,027,471 (CY = 502,805; FY = 524,666) qualified sequences were obtained from the 10 samples. These valid sequences were clustered into 3,617 operational taxonomic units (OTUs) based on 97% nucleotide sequence similarity. For downstream analyses, OTUs with a mean tag count ≥1 within a group were retained. As shown in the Venn diagram (Figure 1A), both groups shared a large core microbiota (685 OTUs), whereas the CY and FY groups shared 826 and 630 OTUs, respectively (Figure 1B). The coverage of the dominant taxa was adequate, as indicated by the rapid rise of Shannon rarefaction curves and the attainment of stable plateaus by 10,000 reads across all samples. Most libraries showed similar Shannon diversity (≈5.8–6.3), although one captive sample (C3) remained consistently lower (Figure 1C). Furthermore, rank–abundance plots (log10 scale) indicated community structures with long rare-taxa tails that were broadly similar, except for C3. The latter displayed a steeper decline with a shorter tail, consistent with reduced richness and evenness relative to the other samples (Figure 1D).
Table 1. Sequencing statistics for captive (CY) and free-range (FY) yak fecal samples
| Sample name | Raw reads | Clean reads | Raw tags | Clean tags | Chimera | Effective tags | Effective ratio (%) |
|---|---|---|---|---|---|---|---|
| C1 | 132020 | 131913 | 129866 | 128748 | 27135 | 101613 | 76.97 |
| C2 | 130072 | 129951 | 128034 | 127120 | 27953 | 99167 | 76.24 |
| C3 | 122743 | 122640 | 120565 | 119739 | 23186 | 96553 | 78.66 |
| C4 | 133853 | 133731 | 131781 | 130723 | 26730 | 103993 | 77.69 |
| C5 | 131313 | 131207 | 129233 | 128330 | 26851 | 101479 | 77.28 |
| F1 | 131884 | 131736 | 129916 | 129417 | 16123 | 113294 | 85.90 |
| F2 | 130964 | 130686 | 128619 | 127768 | 23492 | 104276 | 79.62 |
| F3 | 123133 | 122965 | 121047 | 120309 | 22486 | 97823 | 79.44 |
| F4 | 132275 | 132101 | 130059 | 129269 | 24058 | 105211 | 79.54 |
| F5 | 120147 | 119837 | 118061 | 117565 | 13503 | 104062 | 86.61 |

Figure 1. OTU distribution and sequencing depth assessment. (A) Venn diagram. (B) OTU histogram. (C) Shannon rarefaction curve. (D) Species abundance curve.
Analysis of α-diversity between captive and free-range yaks
The α-diversity of intestinal flora in yaks with different husbandry practices indicates no significant difference between the FY and CY groups, despite the FY group consistently exhibiting higher diversity and species richness. As depicted in Figure 2, Wilcoxon rank-sum tests for observed richness (Sob), Chao1, ACE, Shannon, and Simpson showed no significant differences between CY and FY (Shannon p = 0.5476; ACE p = 0.8413; Chao1 p = 0.4206; Simpson p = 0.2222; Sob p = 0.6905; all p > 0.05). Thus, no group-level differences in richness or evenness were detected at the chosen rarefaction depth, implying that husbandry or feeding style did not significantly alter the overall α-diversity of yak gut microbiota.
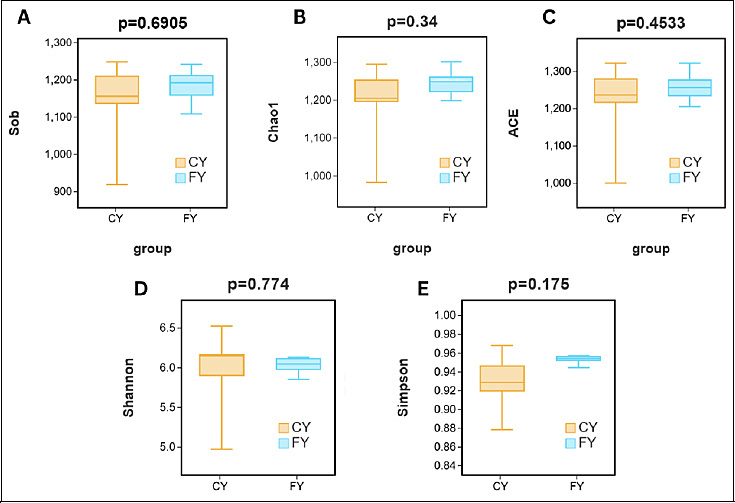
Figure 2. Box plots of statistical tests for the diversity of intestinal microbial communities in captive and free-ranging yaks. (A) The Sob index of bacterial diversity. (B) Chao1 index of bacterial diversity. (C) ACE index of bacterial diversity. (D) Shannon index of bacterial diversity. (E) Simpson index of bacterial diversity.
Analysis of β-diversity between captive and free-range yaks
While α-diversity reflects within-sample richness and evenness, β-diversity analysis was used to assess how microbial community composition differed between CY and FY yaks. As shown in Figure 3A, PCoA based on unweighted UniFrac distance revealed a clear separation of gut microbial communities between the CY and FY groups, with PC1 (30.52%) and PC2 (12.25%) together explaining 42.77% of the total variance. Notably, the FY samples formed a more compact cluster, indicating lower within-group dispersion (i.e., greater community homogeneity) than the CY samples.
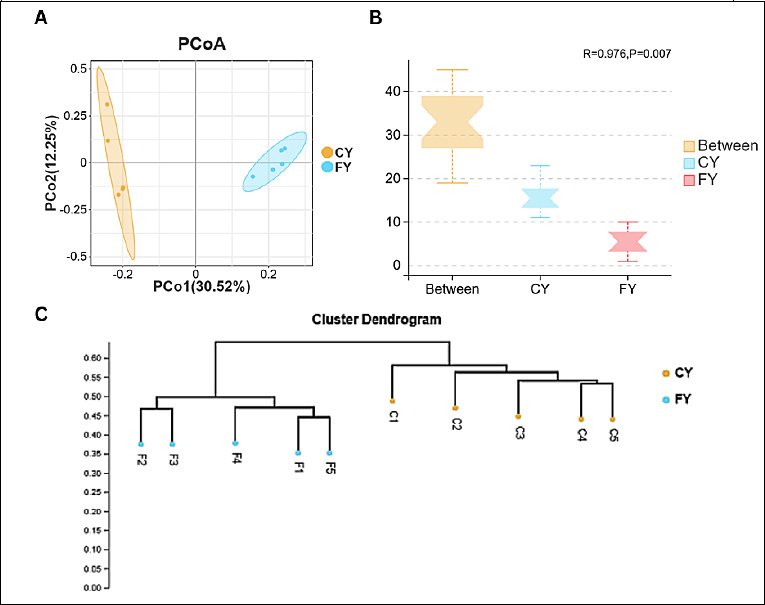
Figure 3. (A) Principal coordinate analysis (PCoA) based on unweighted UniFrac distance showing clear separation between captive (CY) and free-range (FY) yaks. (B) Analysis of similarities (ANOSIM) confirms that between-group dissimilarities exceeded within-group dissimilarities (R = 0.976, p = 0.007). (C) UPGMA hierarchical clustering based on unweighted UniFrac distance, grouping samples according to husbandry system.
Analysis of similarities (ANOSIM) demonstrated that between-group dissimilarities were significantly greater than within-group dissimilarities (R = 0.976, p = 0.007) (Figure 3B). The Unweighted Pair Group Method with Arithmetic Mean hierarchical clustering tree based on unweighted UniFrac distance further showed that samples clustered primarily according to the husbandry system, with CY and FY forming distinct branches (Figure 3C). Collectively, these results indicate that although the overall within-sample diversity did not differ significantly between groups, husbandry practice was associated with pronounced differences in microbial community composition, with free-range yaks exhibiting more homogeneous gut microbiota than captive yaks.
Composition of the gut microbiota of captive vs. free-range yaks across taxonomic ranks
Amplicon-based metagenomic profiling of fecal samples from free-range (FY; F1–F5) and captive (CY; C1–C5) yaks revealed 20 phyla, 31 classes, 81 orders, 127 families, and 233 genera. At the phylum level,
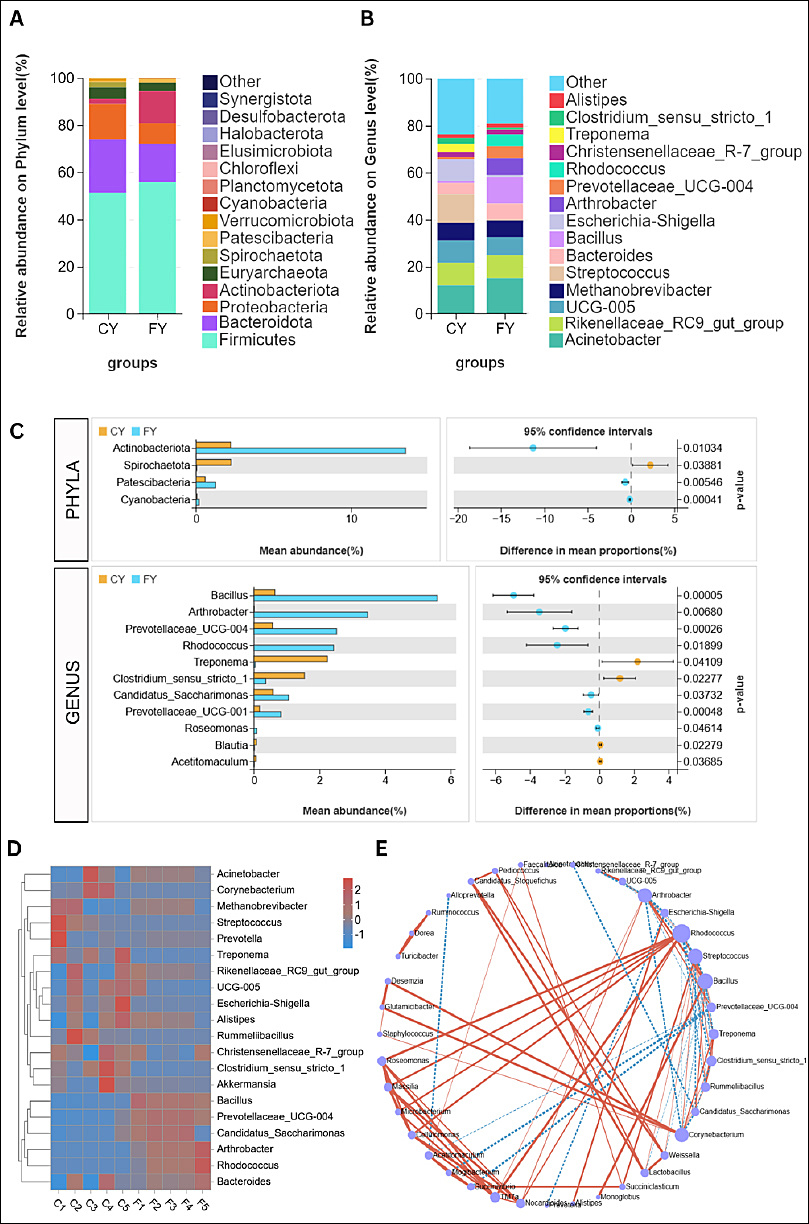
Figure 4. The gut microbiome structure of captive (CY) and free-range (FY) yaks. Overall community composition per group according to stacked bars of the top 15 phyla (A) and 15 genera (B). (C) Comparison of phyla and genera for captive (CY) and free-range (FY) according to Welch’s t-test. (D) Z-score heatmap of individuals in each group against genera with hierarchical clustering. (E) Co-occurrence network of key genera; node size ∝ connectivity (degree). Edges denote significant pairwise associations (p < 0.05); solid red = positive co-occurrence; dashed blue = negative co-occurrence.
At the genus level (Figure 4B), several communities were clearly separated by husbandry practice. CY were enriched with
The genus level differences between CY and FY were mirrored at the individual-sample level, as depicted in the genus heatmap (Figure 4D). All FY (F1–F5) formed a coherent cluster characterized by higher signals for
The co-occurrence network (Figure 4E) demonstrated two opposing modules that aligned with the previous results. An FY module centered on
Together, the compositional, statistical, clustering, and network results show that although both groups share a
Functional prediction
It should be noted that all functional profiles reported here are predictions inferred from
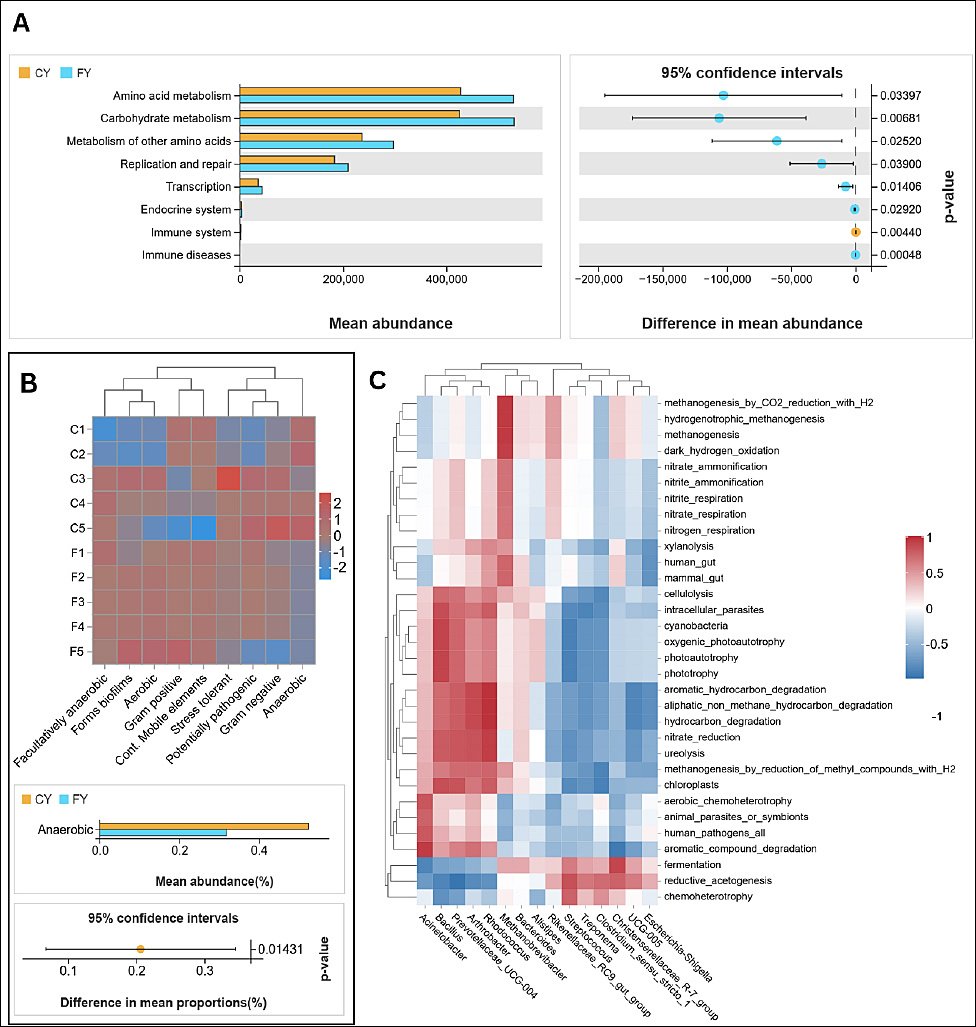
Figure 5. (A) PICRUSt2 KEGG predicted metabolic pathway abundance in group means (CY vs. FY), mean difference with 95% CI. KEGG L2 labels reflect bacterial gene annotations only. (B) BugBase phenotype structure across samples (top: clustered heatmap); bottom: statistical group difference (p-value < 0.05). (C) Spearman correlations between FAPROTAX ecological functions and the top 15 genera. p ≤ 0.001, p ≤ 0.01, p ≤ 0.05. Rows grouped by functions; columns by the top 15 genera.
At KEGG level 3 (Supplement 2), the FY enrichment was driven by the central-carbon and fiber-driven routes. The metabolic pathways involved include glycolysis/gluconeogenesis, pyruvate metabolism, the citrate (TCA) cycle, the pentose-phosphate pathway, amino-sugar and nucleotide-sugar metabolism, glyoxylate/dicarboxylate metabolism, and propanoate/butanoate metabolism, as well as broad amino acid pathways (alanine/aspartate/ glutamate; glycine/serine/threonine; cysteine/methionine; arginine/proline; histidine; tryptophan) and cofactor/ vitamin biosynthesis (pantothenate–CoA, folate one-carbon pool, lipoic acid). FY also showed higher fatty acid biosynthesis, including unsaturated fatty acids. However, the CY group displayed selective increases in carotenoid biosynthesis, sesquiterpenoid and triterpenoid biosynthesis, type II polyketide backbone biosynthesis, and nitrotoluene degradation. Notably, most of the other xenobiotic degradation routes (bisphenol, styrene, atrazine, and polycyclic aromatic hydrocarbons) were higher in FY. The community phenotype from BugBase also supports this metabolic split, as the anaerobic phenotype was significantly higher in CY (Welch’s t, p = 0.01431), whereas other phenotypes showed no groupwise differences (Figure 5B).
In addition to metabolic pathway prediction, the ecological functions of the gut microbiota were predicted using FAPROTAX and linked to the top 15 genera using a dynamic correlation heatmap (Figure 5C). Chemoheterotrophy, fermentation, and reductive acetogenesis were positively correlated with CY-enriched taxa (
DISCUSSION
Community structure and β-diversity patterns
The effects of different husbandry practices on the diversity and structure of yak gut microbiota were investigated using high-throughput sequencing of the
Taxonomic shifts between captive and free-range yak populations
Firmicutes and Bacteroidetes were the most dominant phyla in both groups at the phylum level, consistent with previous observations in ruminants [24]. In this study, the total abundance of Firmicutes (CY: 51.25%, FY: 55.69%) and Bacteroidetes (CY: 22.49%, FY: 16.36%) did not differ significantly between groups. Firmicutes in the gastrointestinal tract can effectively degrade cellulose and hemicellulose, contributing to energy extraction from fibrous plant material [25], whereas Bacteroidetes participate in the degradation of non-fibrous complex polysaccharides and in maintaining gut balance [26]. The Firmicutes-to-Bacteroidetes ratio has been proposed as an indicator of fiber degradation capacity in ruminants [27–29]. However, in the present study, the differences in this ratio between CY and FY were modest and should be interpreted cautiously. At the genus level, differential abundance analysis revealed distinct shifts in dominant microbial taxa between the CY and FY groups, highlighting the influence of feeding regime on gut microbiota composition. Treponema and
The enrichment of pathogenic indicators, such as
Predicted functional implications
The functional profiles of the gut microbiota were predicted using PICRUSt2, BugBase, and FAPROTAX. The taxonomic and predicted functional differences observed between CY and FY yaks suggest that free-range management may favor gut microbial communities with greater potential for fiber degradation and diverse metabolic capacities under high-altitude grazing conditions, whereas captive feeding may be associated with distinct fermentative and potentially opportunistic taxa. Inferred functional pathways suggested that FY communities may have a higher potential for fiber-related carbohydrate metabolism and central-carbon processing, including xylan/cellulose use and glycolysis–TCA-related routes [39–41]. The predicted enrichment of propanoate and butanoate metabolism in FY yaks is consistent with a possible increase in VFA production, which is important for ruminant energy supply [42]. At the same time, predicted nitrogen transformation functions and amino acid biosynthesis pathways may indicate capacity for ammonia assimilation and microbial protein formation [43, 44]. FY yaks also showed predicted enrichment of B-vitamin/cofactor biosynthesis and fatty acid–related pathways, which could contribute to vitamin supply and lipid precursors [45].
However, all of these functional profiles are based on
Study limitations
This study has several limitations. First, the sample size was small (n = 10) due to the constraints of field sampling in remote pastoral regions, which limited the statistical power of the differential abundance and functional inference analyses. Second, PICRUSt2, BugBase, and FAPROTAX provide inference-based functional profiles rather than direct measurements; therefore, metagenomic and metabolomic validation is required. Third, key metadata (e.g., sex, body weight, physiological status, parasite burden, antibiotic history, and detailed dietary intake) were unavailable in herder-managed livestock and may have confounded the observed associations, despite sampling animals of similar age from a single herd within each system. Fourth, the cross-sectional design precludes inference about temporal dynamics or causality, and only fecal samples were analyzed, which may not fully reflect the rumen microbiota. Finally, fermentation metabolites (e.g., SCFAs) were not measured, limiting the link between microbial shifts and host metabolism. Overall, the findings should be viewed as preliminary and hypothesis-generating.
CONCLUSION
This study demonstrated that husbandry practices significantly shape the gut microbiome of yaks (
DATA AVAILABILITY
The original sequencing data generated in this study have been deposited in the National Center for Biotechnology Information Sequence Read Archive (SRA). The data are available under the National Center for Biotechnology Information BioProject accession number PRJNA1380723.
AUTHORS’ CONTRIBUTIONS
YB: Conceptualization, methodology, and writing—original draft preparation. LR: Conceptualization, methodology, data curation, and writing—original draft preparation. FS: Methodology and writing—review and editing. MR: Writing—review and editing. WS: Writing—review and editing. All authors have read and approved the final version of the manuscript.
COMPETING INTERESTS
The authors declare that they have no competing interests.
PUBLISHER’S NOTE
Veterinary World remains neutral with regard to jurisdictional claims in the published institutional affiliations.
ACKNOWLEDGMENTS
We would like to sincerely thanks the Sichuan Provincial Transfer Payment Program and Sichuan Minzu College Ecology Discipline Development Project for their financial support, which made this research possible. We also extend our gratitude to the Li Tang County Yak Industry Park for their invaluable assistance in sample collection and analysis. Finally, we appreciate the contributions of Gene Denovo Company for their technical support. The Sichuan Minzu College Ecology Discipline Development Project funded this research.
REFERENCES
- Liu W, Wang Q, Song J, Xin J, Zhang S, Lei Y. Comparison of gut microbiota of yaks from different geographical regions. Front Microbiol 2021;12:666940. [Google Scholar] | [Crossref]
- Zhang Q, E G, Ping CZ, Basang W. Research progress on the exploitation and utilization of yak resources in China. Anim Nutr 2023;35(12):7492-7518. [Google Scholar] | [Crossref]
- Cui P, Feng L, Zhang L, He J, An T, Fu X. Antimicrobial resistance, virulence genes, and biofilm formation capacity among
Enterococcus species from yaks in Aba Tibetan Autonomous Prefecture, China. Front Microbiol 2020;11:1250. [Google Scholar] | [Crossref] - Wang Y, Chen F, Zhang W, Guo J, Ma Z, Hu S. High throughput sequencing analyzed changes in the yak rumen microflora after Qinghai yaks introduced to Shandong. China Anim Husb Vet Med 2020;47((07)):2013-2024. [Google Scholar] | [Crossref]
- Wei X, Dong Z, Cheng F, Shi H, Zhou X, Li B. Seasonal diets supersede host species in shaping the distal gut microbiota of yaks and Tibetan sheep. Sci Rep 2021;11(1):22626. [Google Scholar] | [Crossref]
- Liu J, Wang X, Zhang W, Kulyar MF, Ullah K, Han Z. Comparative analysis of gut microbiota in healthy and diarrheic yaks. Microb Cell Fact 2022;21(1):111. [Google Scholar] | [Crossref]
- Wang X, Zhang Z, Li B, Hao W, Yin W, Ai S. Depicting fecal microbiota characteristic in yak, cattle, yak-cattle hybrid and Tibetan sheep in different eco-regions of Qinghai-Tibetan Plateau. Microbiol Spectr 2022;10(4):e0002122. [Google Scholar] | [Crossref]
- Liu C, Zhang L, Fu H, Li W, Zhang H. Relationship research between fecal microbes and short chain fatty acid between wild yak and domestic yak. Acta Theriol Sin 2019;39(1):1-7. [Google Scholar] | [Crossref]
- Liu W, Wang Q, Song J, Xin J, Zhang S, Lei Y. Comparison of gut microbiota of yaks from different geographical regions. Front Microbiol 2021;12:666940. [Google Scholar] | [Crossref]
- Pang KY, Dai DW, Yang YK, Wang X, Liu SJ, Zhou ZM. Effects of different feeding practices on rumen fermentation parameters and microflora of yak. Anim Nutr 2022;34(03):1667-1682. [Google Scholar] | [Crossref]
- Lindsay B, Oundo J, Hossain MA, Antonio M, Tamboura B, Walker AW. Microbiota that affect risk for shigellosis in children in low-income countries. Emerg Infect Dis 2015;21(2):242-250. [Google Scholar] | [Crossref]
- Wen Y, Li S, Wang Z, Feng H, Yao X, Liu M. Intestinal microbial diversity of free-range and captive yak in Qinghai Province. Microorganisms 2022;10(4):754. [Google Scholar] | [Crossref]
- Huang X, Mi J, Denman SE, Basangwangdui, Pingcuozhandui, Zhang Q. Changes in rumen microbial community composition in yak in response to seasonal variations. J Appl Microbiol 2022;132(3):1652-1665. [Google Scholar] | [Crossref]
- Magoč T, Salzberg SL. FLASH:fast length adjustment of short reads to improve genome assemblies. Bioinformatics 2011;27(21):2957-2963. [Google Scholar] | [Crossref]
- Bokulich NA, Subramanian S, Faith JJ, Gevers D, Gordon JI, Knight R. Quality-filtering vastly improves diversity estimates from Illumina amplicon sequencing. Nat Methods 2013;10(1):57-59. [Google Scholar] | [Crossref]
- Edgar RC. Search and clustering orders of magnitude faster than BLAST. Bioinformatics 2010;26(19):2460-2461. [Google Scholar] | [Crossref]
- Wang Q, Garrity GM, Tiedje JM, Cole JR. Naïve Bayesian classifier for rapid assignment of rRNA sequences into the new bacterial taxonomy. Appl Environ Microbiol 2007;73(16):5261-5267. [Google Scholar] | [Crossref]
- Simpson GL, Solymos P, Stevens MHH, Wagner H. vegan:community ecology package. R package version 1.17-4 2010. [Google Scholar] | [Crossref]
- Xin J, Chai Z, Zhang C, Zhang Q, Zhu Y, Cao H. Comparing the microbial community in four stomach of dairy cattle, yellow cattle and three yak herds in Qinghai-Tibetan Plateau. Front Microbiol 2019;10:1547. [Google Scholar] | [Crossref]
- Shang Z, Tan Z, Kong Q, Shang P, Wang H, Zhaxi W. Characterization of fungal microbial diversity in Tibetan sheep, Tibetan gazelle and Tibetan antelope in the Qiangtang region of Tibet. Mycoscience 2022;63(4):156-164. [Google Scholar] | [Crossref]
- Su Y, Su J, Li F, Tian X, Liu Z, Ding G. Yak gut microbiota:a systematic review and meta-analysis. Front Vet Sci 2022;9:889594. [Google Scholar] | [Crossref]
- Ahmad HI, Mahmood S, Hassan M, Sajid M, Ahmed I, Shokrollahi BH. Genomic insights into yak (
Bos grunniens ) adaptations for nutrient assimilation in high-altitudes. Sci Rep 2024;14(1):5650. [Google Scholar] | [Crossref] - Wang R, Bai B, Huang Y, Degen A, Mi J, Xue Y. Yaks are dependent on gut microbiota for survival in the environment of the Qinghai Tibet Plateau. Microorganisms 2024;12(6):1122. [Google Scholar] | [Crossref]
- Chi X, Gao H, Wu G, Qin W, Song P, Wang L. Comparison of gut microbiota diversity between wild and captive bharals (
Pseudois nayaur ). BMC Vet Res 2019;15((1)):243. [Google Scholar] | [Crossref] - Zhang XL, Xu TW, Wang XG, Geng YY, Liu HJ, Hu LY. The effect of transitioning between feeding methods on the gut microbiota dynamics of yaks on the Qinghai-Tibet Plateau. Animals (Basel) 2020;10(9):1641. [Google Scholar] | [Crossref]
- Gong G, Zhou S, Luo R, Gesang Z, Suolang S. Metagenomic insights into the diversity of carbohydrate-degrading enzymes in the yak fecal microbial community. BMC Microbiol 2020;20(1):302. [Google Scholar] | [Crossref]
- Fu H, Zhang L, Fan C, Liu C, Li W, Li J. Domestication shapes the community structure and functional metagenomic content of the yak fecal microbiota. Front Microbiol 2021;12:594075. [Google Scholar] | [Crossref]
- Zeng Z, He X, Li F, Zhang Y, Huang Z, Wang Y. Probiotic properties of
Bacillus proteolyticus isolated from Tibetan yaks, China. Front Microbiol 2021;12:649207. [Google Scholar] | [Crossref] - Zeng Z, Zhang J, Li Y, Li K, Gong S, Li F. Probiotic potential of
Bacillus licheniformis andBacillus pumilus isolated from Tibetan yaks, China. Probiotics Antimicrob Proteins 2022;14(3):579-594. [Google Scholar] | [Crossref] - Firrincieli A, Minuti A, Cappelletti M, Ferilli M, Ajmone-Marsan P, Bani P. Structural and functional analysis of the active cow rumen's microbial community provides a catalogue of genes and microbes participating in the deconstruction of cardoon biomass. Biotechnol Biofuels Bioprod 2024;17(1):53. [Google Scholar] | [Crossref]
- Cao L, Liu Z, Yu Y, Liang Q, Wei X, Sun H. Butyrogenic effect of galactosyl and mannosyl carbohydrates and their regulation on piglet intestinal microbiota. Appl Microbiol Biotechnol 2023;107((5-6)):1903-1916. [Google Scholar] | [Crossref]
- Schwab C, Cristescu B, Northrup JM, Stenhouse GB, Gänzle M. Diet and environment shape fecal bacterial microbiota composition and enteric pathogen load of grizzly bears. PLoS One 2011;6(12):e27905. [Google Scholar] | [Crossref]
- Jenkins TC, Wallace RJ, Moate PJ, Mosley EE. Board-invited review:recent advances in biohydrogenation of unsaturated fatty acids within the rumen microbial ecosystem. J Anim Sci 2008;86(2):397-412. [Google Scholar] | [Crossref]
- El-Saadony MT, Alagawany M, Patra AK, Kar I, Tiwari R, Dawood MAO. The functionality of probiotics in aquaculture:an overview. Fish Shellfish Immunol 2021;117:36-52. [Google Scholar] | [Crossref]
- Liu Y, Zhang Y, Huang Y, Niu J, Huang J, Peng X. Spatial and temporal conversion of nitrogen using
Arthrobacter sp. 24S4-2, a strain obtained from Antarctica. Front Microbiol 2023;14:1040201. [Google Scholar] | [Crossref] - Ward AL, Reddyvari P, Borisova R, Shilabin AG, Lampson BC. An inhibitory compound produced by a soil isolate of
Rhodococcus has strong activity against the veterinary pathogen R. equi. PLoS One 2018;13(12):e0209275. [Google Scholar] | [Crossref] - Gao F, Zhang W, Cao M, Liu X, Han T, He W. Maternal supplementation with konjac glucomannan improves maternal microbiota for healthier offspring during lactation. J Sci Food Agric 2024;104(6):3736-3748. [Google Scholar] | [Crossref]
- Accetto T, Avguštin G. The diverse and extensive plant polysaccharide degradative apparatuses of the rumen and hindgut
Prevotella species:a factor in their ubiquity?. Syst Appl Microbiol 2019;42(2):107-116. [Google Scholar] | [Crossref] - Russell JB, Rychlik JL. Factors that alter rumen microbial ecology. Science 2001;292(5519):1119-1122. [Google Scholar] | [Crossref]
- Weimer PJ. Degradation of cellulose and hemicellulose by ruminal microorganisms. Microorganisms 2022;10(12):2345. [Google Scholar] | [Crossref]
- Van Soest PJ. Nutritional ecology of the ruminant. Ithaca, NY: Cornell University Press; 1994. [Google Scholar]
- Ma X, La Y, Yang G, Dai R, Zhang J, Zhang Y. Multi-omics revealed the effects of dietary energy levels on the rumen microbiota and metabolites in yaks under house-feeding conditions. Front Microbiol 2023;14:1309535. [Google Scholar] | [Crossref]
- Wallace RJ, Onodera R, Cotta MA, Hobson PN, Stewart CS. Metabolism of nitrogen-containing compounds. London: Blackie Academic &Professional; 1997. p. 283-328. [Google Scholar]
- Morrison M. Do ruminal bacteria produce enzymes which hydrolyse peptides?The identification and roles of proteolytic enzymes from the anaerobe
Streptococcus bovis . J Gen Microbiol 1996;142(6):1467-1475. [Google Scholar] | [Crossref] - Tarracchini C, Bottacini F, Mancabelli L, Lugli GA, Turroni F, van Sinderen D. Approaches to dissect the vitamin biosynthetic network of the gut microbiota. Microbiome Res Rep 2025;4((3)). [Google Scholar] | [Crossref]
- Henderson G, Cox F, Ganesh S, Jonker A, Young W. Rumen microbial community composition varies with diet and host, but a core microbiome is found across a wide geographical range. Sci Rep 2015;5:14567. [Google Scholar] | [Crossref]